- Search Forex Factory
- 199 Results
-
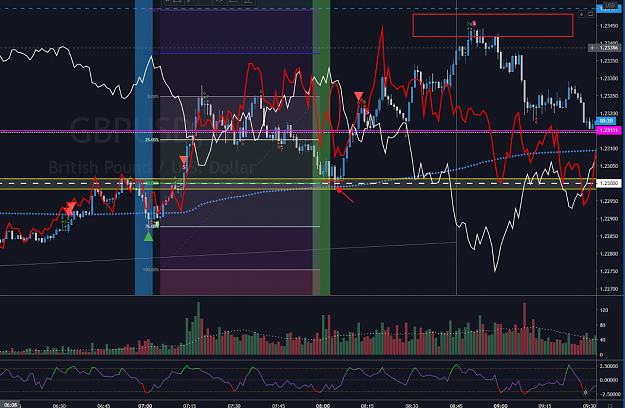
 copi88 replied Apr 30, 2020
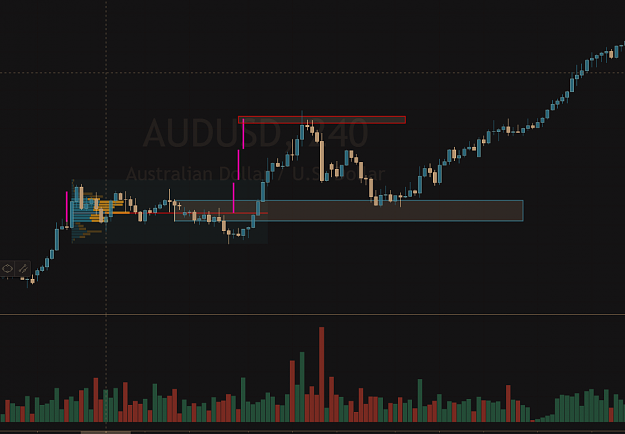
image anyone wondering why its going up its due to month end book balancing by the pension funds See how price was flat , it had to trade up to the green line for them to balance their books by buying the currency
Cable Update (GBPUSD)
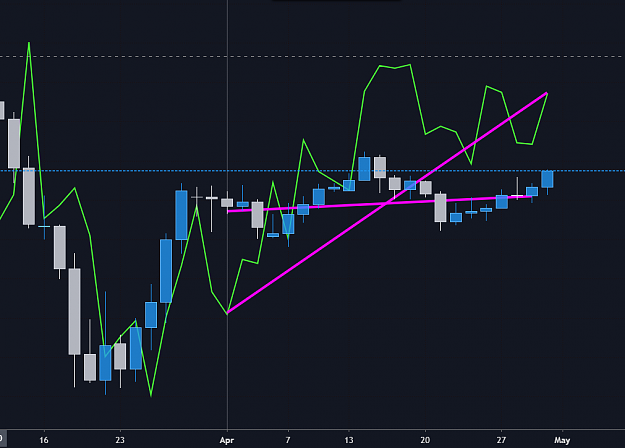
- copi88 replied Apr 30, 2020
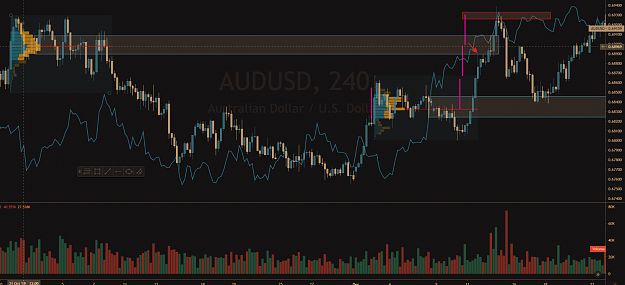
Month End book balancing. See how price is flat but the green line went up. This mean funds will need to buy the currency to balance their books image
EURUSD only

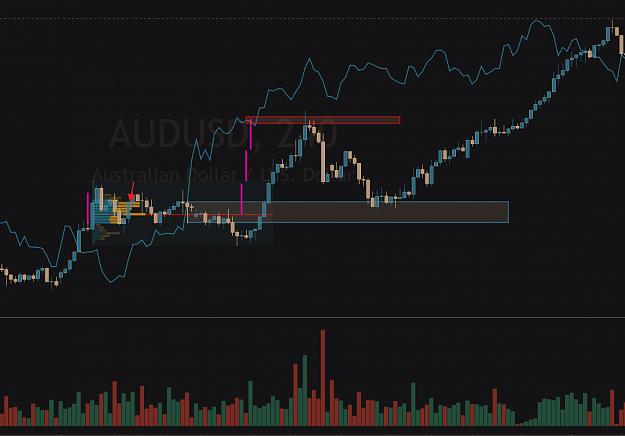
- copi88 replied Apr 22, 2020
That analysis was on AUDUSD. You definitely can be a successful trader using just technical, or just fundamental but then perhaps your win rate will be around 65% if you are very good. The way I was trained was to use value models in conjunction ...
Real or Algo
- copi88 replied Apr 12, 2020
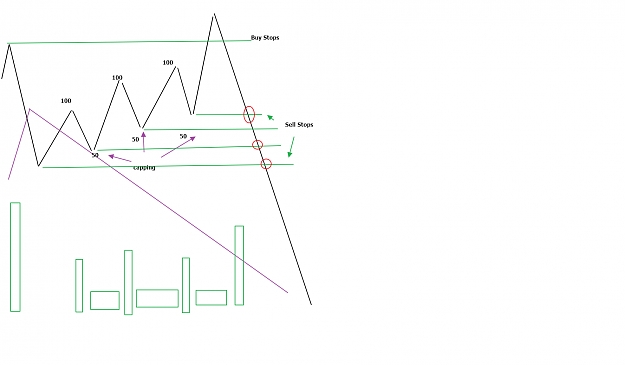
All one needs to do to identify Institutional Supply or Demand zones is too look for balance areas from which there is a fast money move away. By fast money I mean a rapid movement of price away from the balance area. Rapid moves like this are ...
Sam Seiden Goes DOWN

- copi88 replied Mar 25, 2020
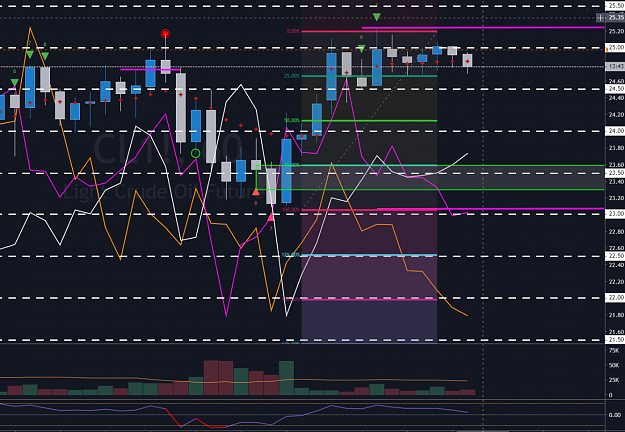
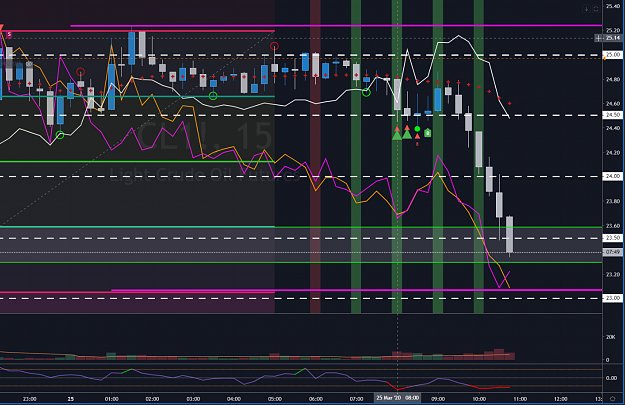
Again so much value to the downside coming into the open. too easy image image
WTI Crude Oil Trading
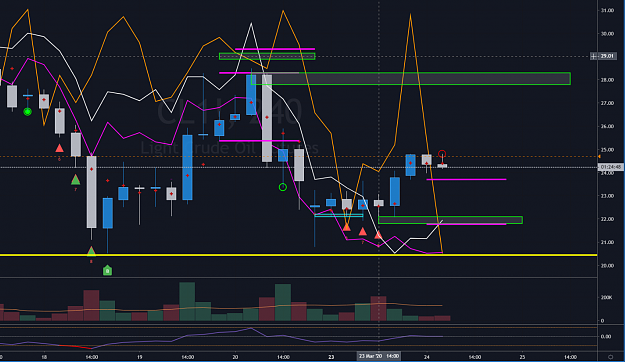
- copi88 replied Mar 24, 2020
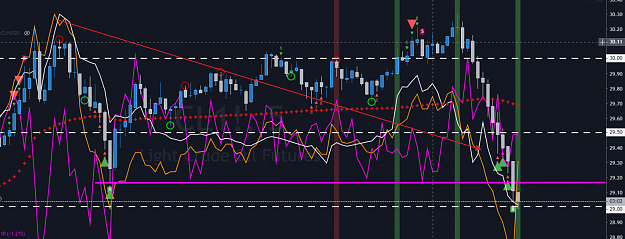
All the value lines are to the downside. Lots of short macro value... image
WTI Crude Oil Trading
- copi88 replied Mar 20, 2020
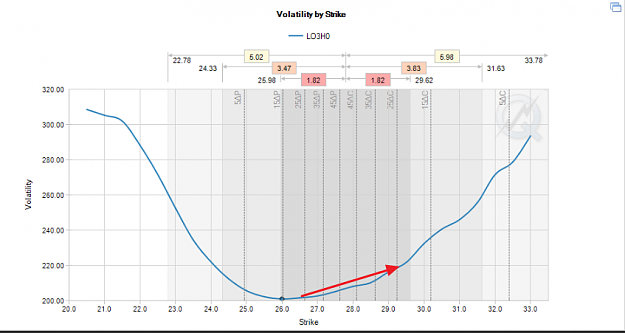
We have an upward sloping volatility curve on Oil on the weekly option contract for the 1st time in a very long time. This is bullish oil as the market is pricing Calls higher than they are pricing puts ie the market makers expect the market to go ...
WTI Crude Oil Trading
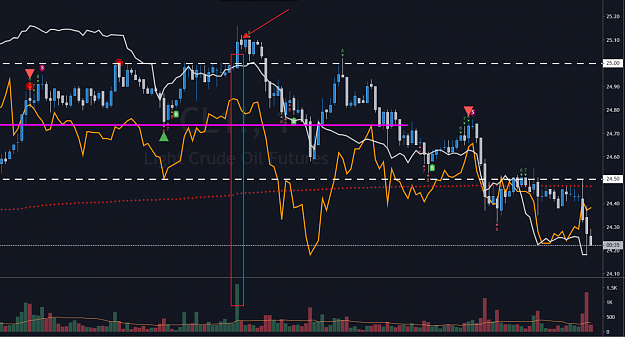
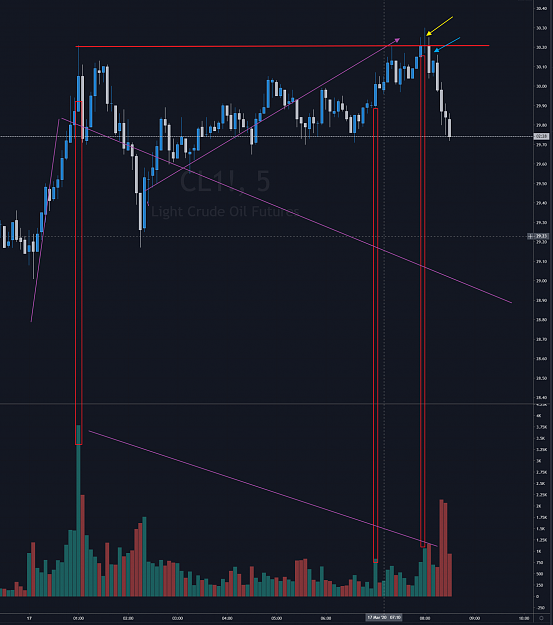
- copi88 replied Mar 17, 2020
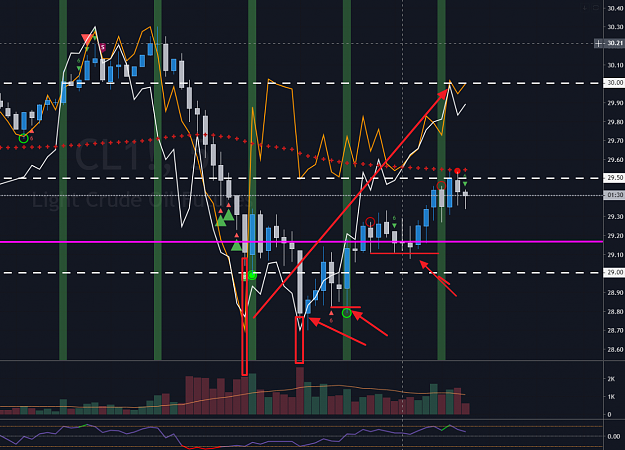
See how they absorbed the highest volume of the day. Value was going up. Every time a pivot level was broken lower they bought that liquidity. Those red arrows are my buys. image one more image
WTI Crude Oil Trading
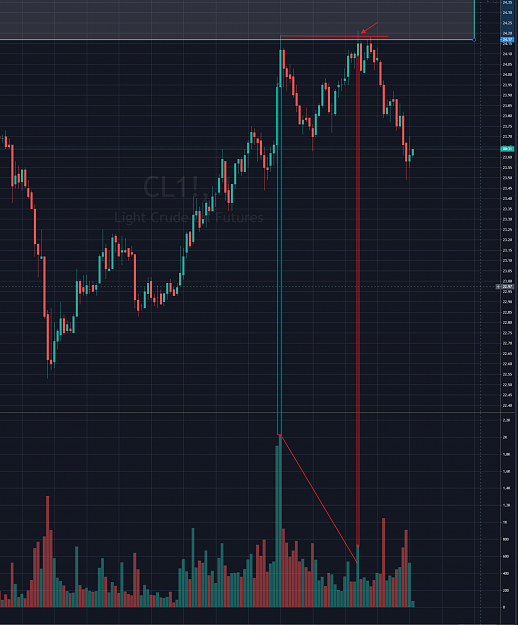
- copi88 replied Mar 17, 2020
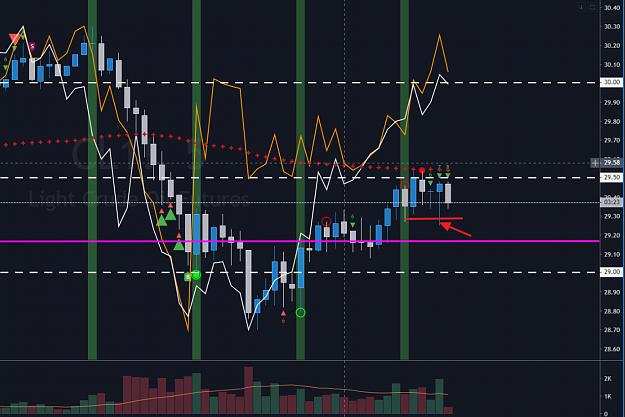
Two most important question you need to ask as a Trader is 1.What did they do with the volume - Large volume bars are used by institutions to either distribute or start their accumulations. Institutions are not that interested in price. They are ...
WTI Crude Oil Trading
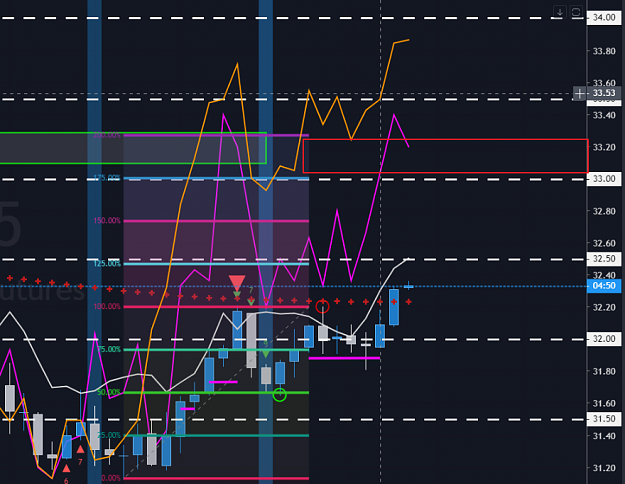
- copi88 replied Mar 13, 2020
its going up. maybe you dont understand what I showed you in that chart above. Those lines indicate where oil should be priced. ie its true value. The target now is 33.00 to 33.25 for this move image
WTI Crude Oil Trading
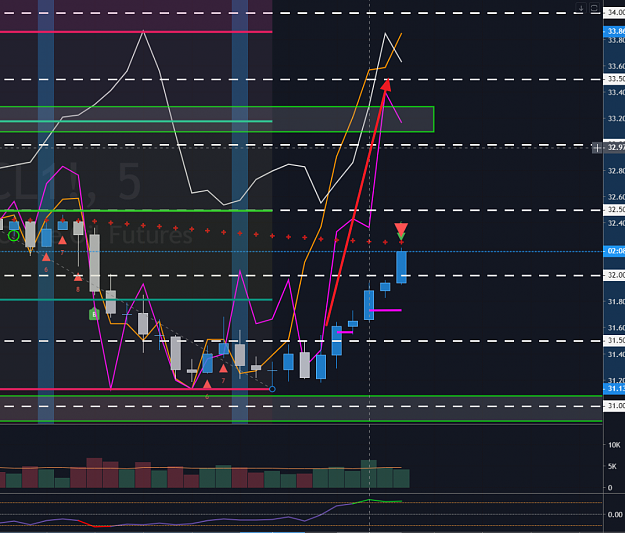
- copi88 replied Mar 13, 2020
Huge pop in value to the long side. you only want to be long for the moment image
WTI Crude Oil Trading
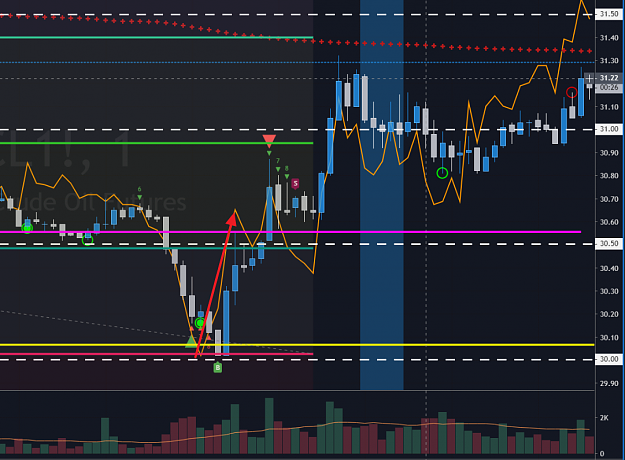
- copi88 replied Mar 13, 2020
800$ trade out of that blue box I drew in yesterday. image
WTI Crude Oil Trading
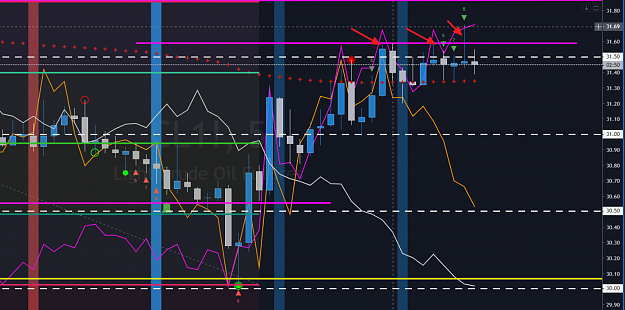
- copi88 replied Mar 12, 2020
I am selling these higher highs as value has gone bearish. Only problem is that the market has gone risk on and entered a bear steepener which is bullish for oil. image
WTI Crude Oil Trading
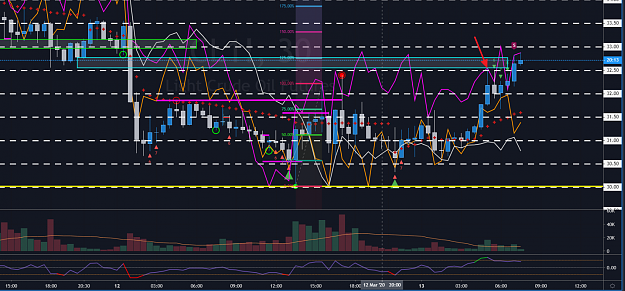
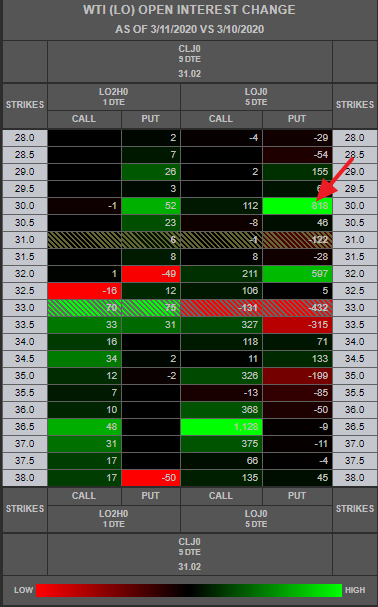
- copi88 replied Mar 12, 2020
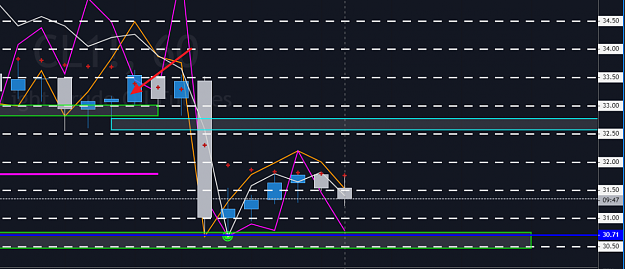
Value when bid strongly for the first time into that low. It was also the 150% extension of the swing area and the previous low. also all the Put vol came in at 30 for the gamma hedgers image image
WTI Crude Oil Trading
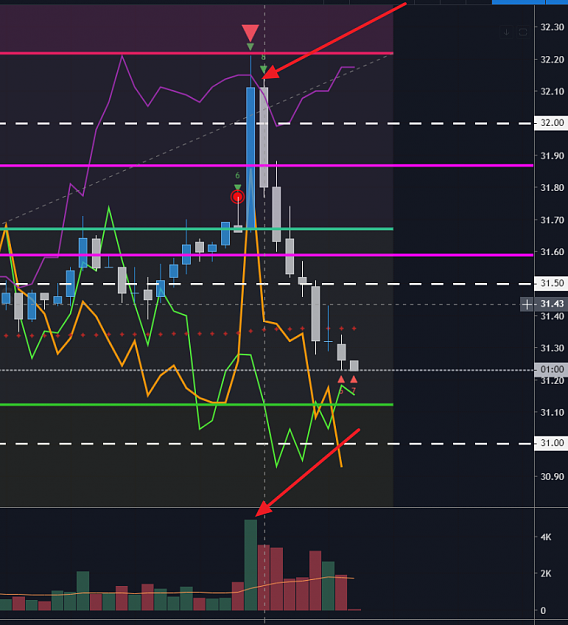
- copi88 replied Mar 12, 2020
There where a ton of buyers trapped in that balance area by the red arrow yesterday. If price revisits into that blue box those buyers will be desperate to get off their trades. Good area to look for shorts. image
WTI Crude Oil Trading
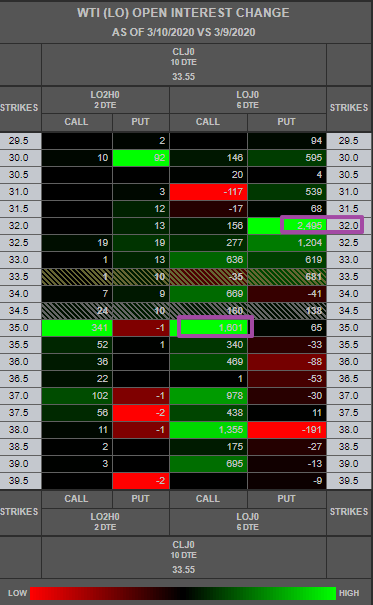
- copi88 replied Mar 11, 2020
32s should be defended and 35s Sold according to the Options market image
WTI Crude Oil Trading