- Search Forex Factory
- 264 Results (1 Thread , 263 Replies )
-
 jmn5611 replied Apr 1, 2022
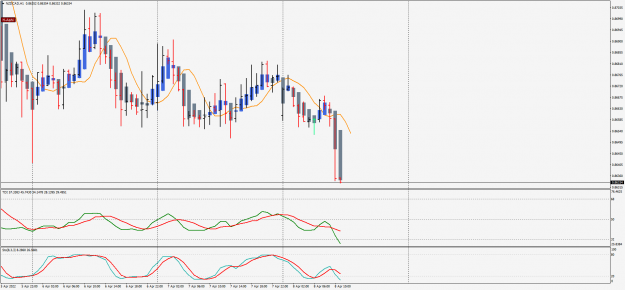
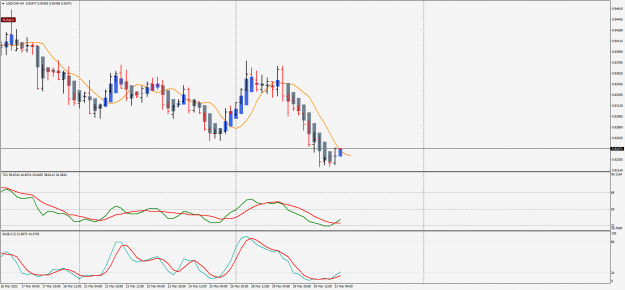
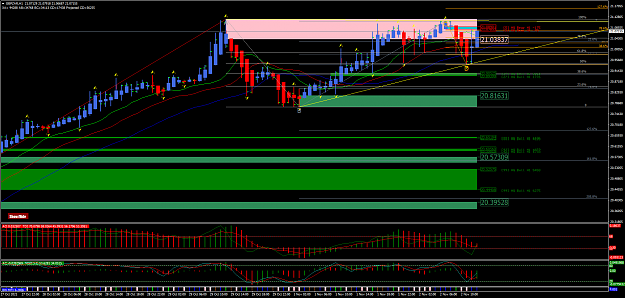
A fade is when you see a cross that is very against the trend. This is not discussed very often I noticed, and it leads to bad trades. image This chart shows a clear cross. Stoch confirms. Price closes above the 5 ema, the cross is below the 32 ...
Trading Made Simple
- jmn5611 replied Mar 31, 2022
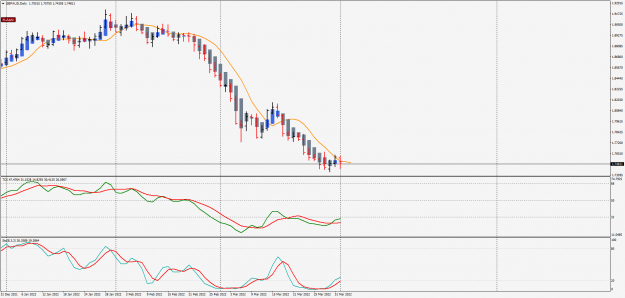
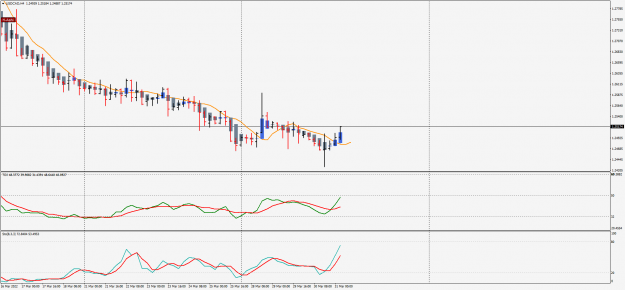
image This is an example of when the stoch does not confirm the TDI. Some have said they are both momo indies, which is true, they both measure different aspects of momentum. They should confirm. If they do not, next pair.
Trading Made Simple the right way, and other trading lessons
- jmn5611 replied Mar 31, 2022
Very fresh H4 chart. Multi candle bottom. Entry would be timely. Stop would be tight. Countertrend trade obviously.
Trading Made Simple the right way, and other trading lessons
- jmn5611 replied Mar 31, 2022
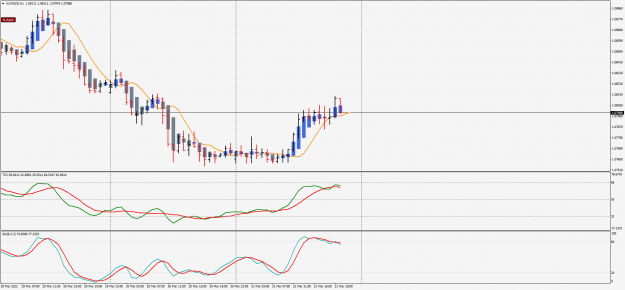
image H4 cross with divergence.
Trading Made Simple the right way, and other trading lessons
- jmn5611 replied Mar 29, 2022
This is an okay H1 chart. If I get a chance I will show some bad signals also. image
Trading Made Simple the right way, and other trading lessons
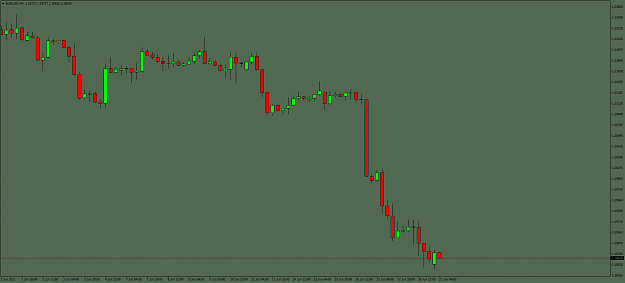
- jmn5611 replied Mar 27, 2022
image This is an off hours chart showing a strong reversal candle coming from what looks like resistance. There is also divergence between the stochastics and price.
Trading Made Simple the right way, and other trading lessons
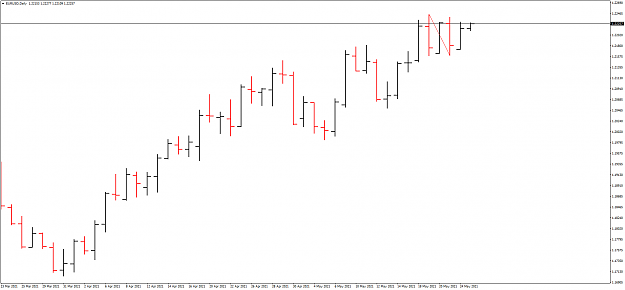
- jmn5611 replied Nov 2, 2021
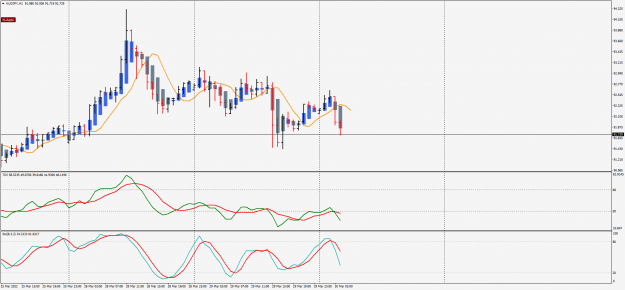
This chart shows a strong cross up. Should we take this trade?
Trading Made Simple
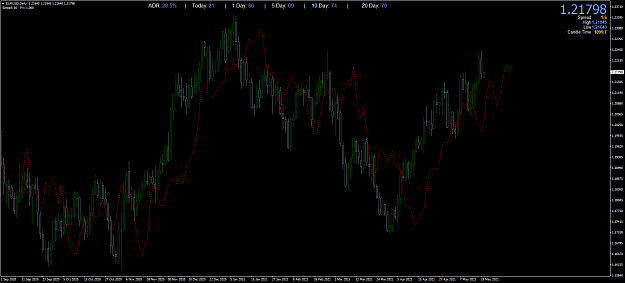
- jmn5611 replied Oct 31, 2021
I decided to blind some people. Yes, the 5 method is on this chart, somewhere.
Trading Made Simple

- jmn5611 replied Sep 19, 2021
That is definitely one way to do it. Most traders have trouble decision making. So, the idea is to keep it simple. The first day of every trading month is a good barometer of weather prices are bullish or bearish, the rest should take care of ...
It Doesn't Smell Right

- jmn5611 replied Jul 4, 2021
GU here in the states is late, will wait for bounce trade.
Trading Made Simple

- jmn5611 replied Jun 20, 2021
Short at 1.19961 Stop at high of most recent swing Take profit in 302 pips Rationale: 50% pullback entry of AB=CD formation
Naked Chart Challenge
- jmn5611 replied Jun 8, 2021
So, a trader with a 30% win rate is likely to cut losses very quickly. It is the exact opposite to a trader with a 90% win rate. A trader with a 90% win rate is probably a Martingale trader. His doom is a mathematical certainty. The point I am ...
Trading Made Simple

- jmn5611 replied May 24, 2021
Update: 5/24/21. Bottom came in on 5/21/21. One trading day from today. Next date target : 5/28/21
Analysis and Trading based on Envelopes, Waves, Cycles
- jmn5611 replied May 19, 2021
Well, after doing some reading on the FLD, I figured out what it is. So I put a 1 period SMA of the median price on the chart and shifted it out 10 days, which represent the 20 day cycle. Does this look right?
Analysis and Trading based on Envelopes, Waves, Cycles
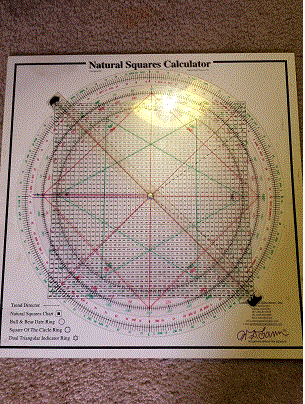
- jmn5611 replied Apr 24, 2021
I suspect that you have given Lambert Gann a lot of money, like I did. I bought everything I could find. The "secret" became so off putting that I realized that I very very deep down a rabbit hole. The Santos coffee letter did not help either, as it ...
Analysis and Trading based on Envelopes, Waves, Cycles
- jmn5611 replied Apr 9, 2021
I remember this debate. I think the OP (whose site, amazingly, is still alive) really was into Gann and there was offense taken with Murrey especially after he began to get traction from his Trader's World articles. The Sacred Science institute did ...
Analysis and Trading based on Envelopes, Waves, Cycles