Markets
Ranked: The World’s 50 Top Countries by GDP, by Sector Breakdown
Article/Editing:
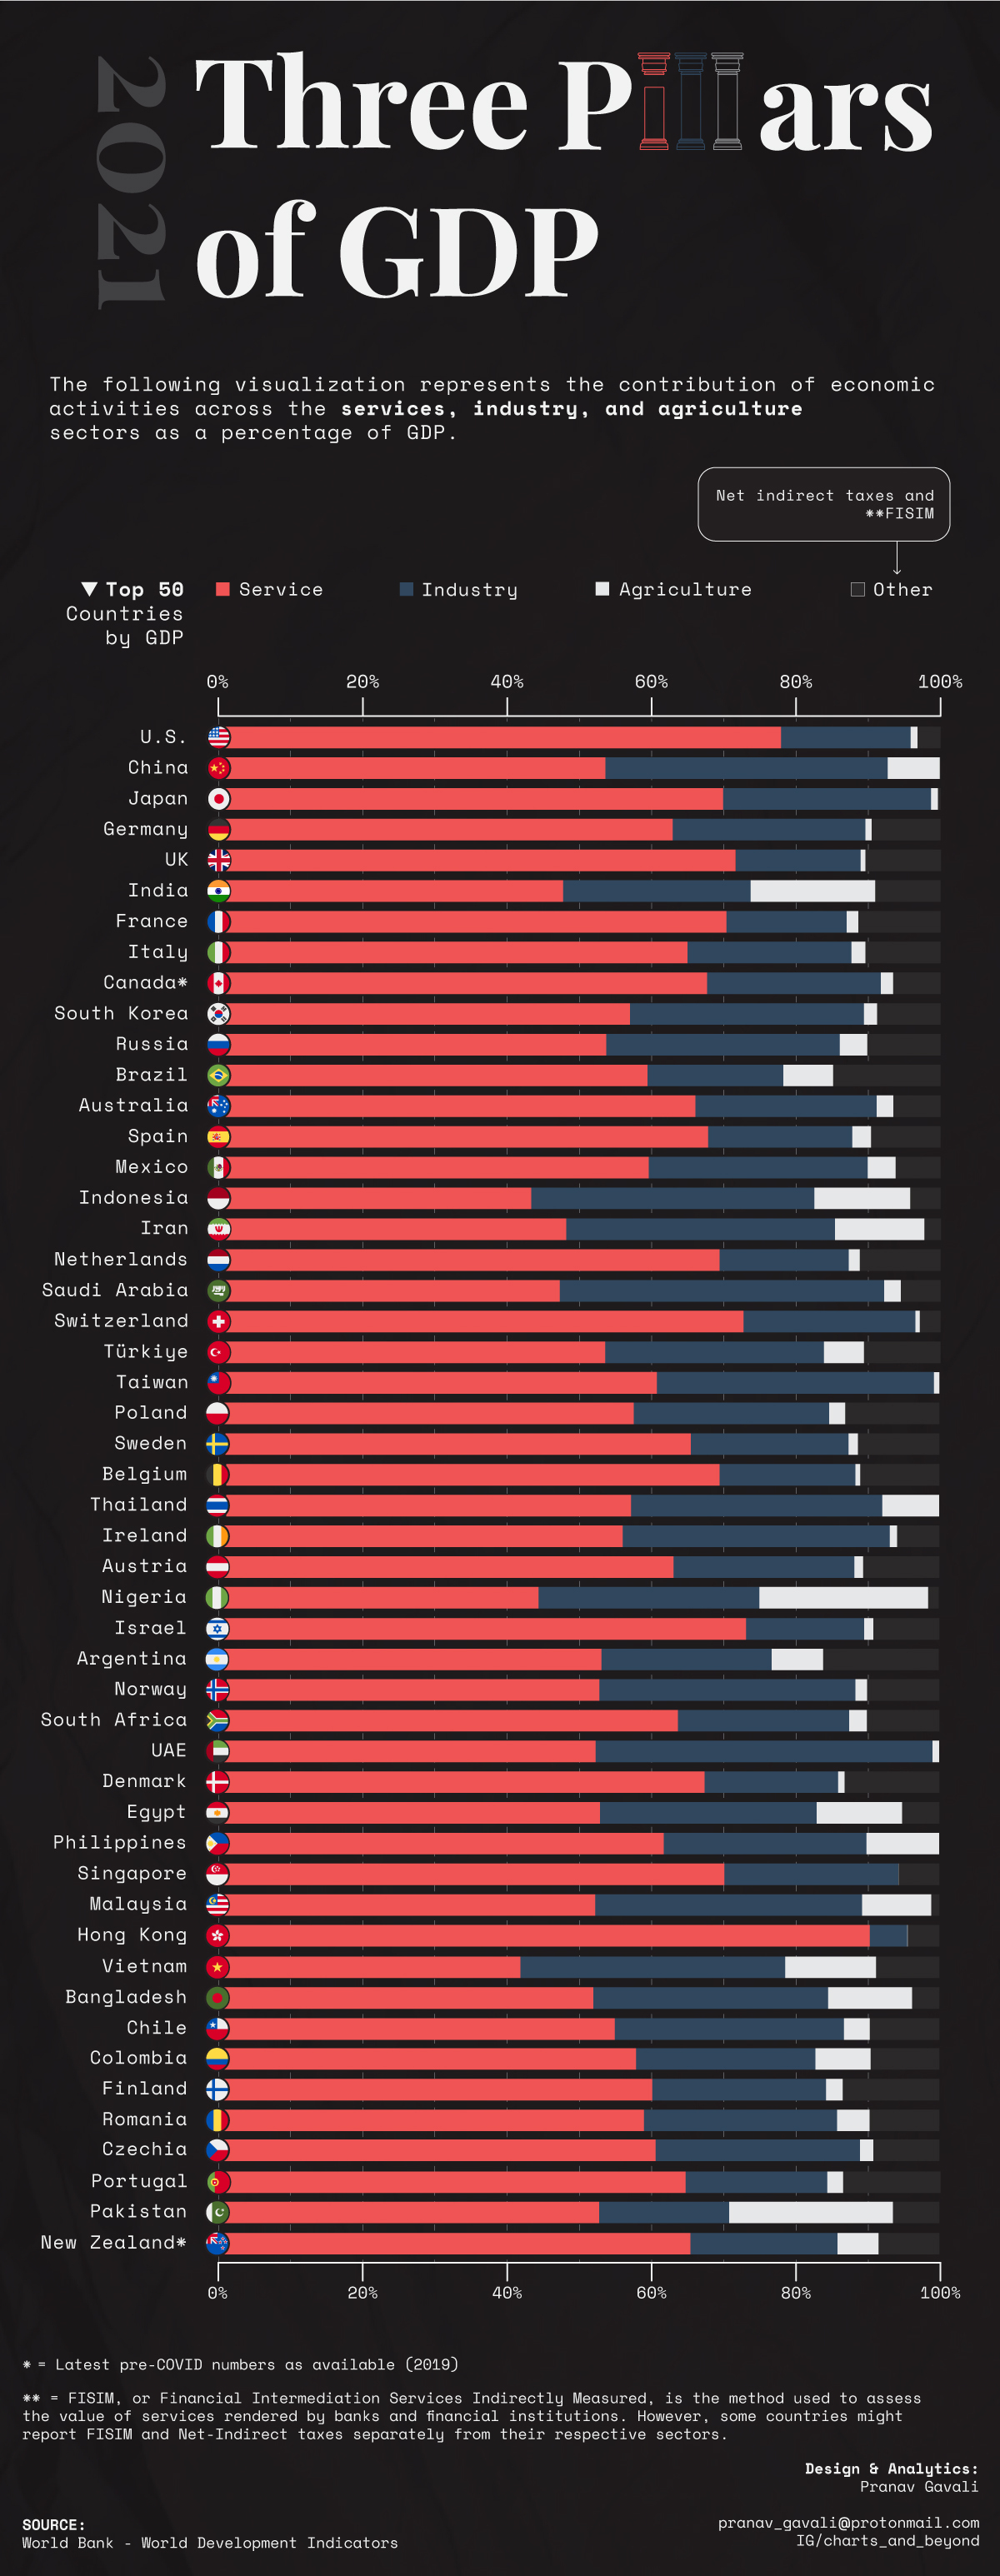
Visualized: The Three Pillars of GDP, by Country
Over the last several decades, the service sector has fueled the economic activity of the world’s largest countries. Driving this trend has been changes in consumption, the easing of trade barriers, and rapid advancements in tech.
We can see this in the gross domestic product (GDP) breakdown of each country, which gets divided into three broad sectors: services, industry, and agriculture.
The above graphic from Pranav Gavali shows GDP by country, and how each sector contributes to an economy’s output, with data from the World Bank.
Drivers of GDP, by Country
As the most important and fastest growing component of GDP, services make up almost 60% of GDP in the world’s 50 largest countries. Following this is the industrial sector which includes the production of raw goods.
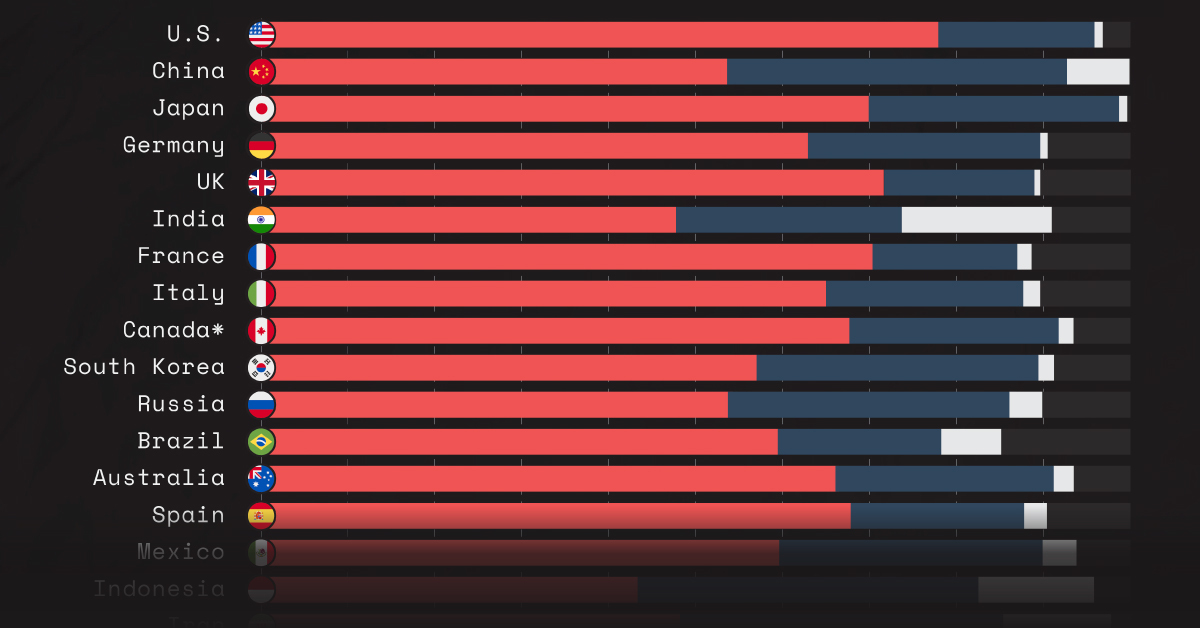
Below, we show how each sector contributes to GDP by country as of 2021:
| Country | Services (% GDP) | Industry (% GDP) | Agriculture (% GDP) | Other (% GDP) | GDP (T) |
|---|---|---|---|---|---|
| 🇺🇸 U.S. | 77.6 | 17.9 | 1.0 | 3.6 | $22.9 |
| 🇨🇳 China | 53.5 | 39.3 | 7.2 | 0.0 | $16.9 |
| 🇯🇵 Japan | 69.9 | 28.8 | 1.0 | 0.4 | $5.1 |
| 🇩🇪 Germany | 62.9 | 26.7 | 0.9 | 9.5 | $4.2 |
| 🇬🇧 UK | 71.6 | 17.3 | 0.7 | 10.4 | $3.1 |
| 🇫🇷 France | 70.3 | 16.7 | 1.6 | 11.4 | $2.9 |
| 🇮🇳 India | 47.9 | 26.1 | 17.3 | 8.7 | $2.9 |
| 🇮🇹 Italy | 65.0 | 22.7 | 1.9 | 10.4 | $2.1 |
| 🇨🇦 Canada* | 67.7 | 24.1 | 1.7 | 6.6 | $2.0 |
| 🇰🇷 South Korea | 57.0 | 32.4 | 1.8 | 8.8 | $1.8 |
| 🇧🇷 Brazil | 57.8 | 20.2 | 7.5 | 14.6 | $1.6 |
| 🇦🇺 Australia | 65.7 | 25.5 | 2.3 | 6.5 | $1.6 |
| 🇷🇺 Russia | 54.1 | 31.8 | 3.9 | 10.3 | $1.6 |
| 🇪🇸 Spain | 67.4 | 20.4 | 2.6 | 9.6 | $1.4 |
| 🇲🇽 Mexico | 59.2 | 30.8 | 3.9 | 6.1 | $1.3 |
| 🇮🇩 Indonesia | 42.8 | 39.8 | 13.3 | 4.1 | $1.2 |
| 🇮🇷 Iran | 47.3 | 38.0 | 12.4 | 2.3 | $1.1 |
| 🇳🇱 Netherlands | 69.4 | 17.9 | 1.5 | 11.2 | $1.0 |
| 🇨🇭 Switzerland | 71.9 | 24.6 | 0.6 | 2.8 | $0.8 |
| 🇹🇷 Turkiye | 52.8 | 31.1 | 5.5 | 10.6 | $0.8 |
| 🇹🇼 Taiwan | 60.6 | 38.0 | 1.5 | 0.0 | $0.8 |
| 🇸🇦 Saudi Arabia | 46.5 | 44.7 | 2.7 | 6.1 | $0.8 |
| 🇵🇱 Poland | 56.9 | 27.9 | 2.2 | 13.0 | $0.7 |
| 🇧🇪 Belgium | 68.8 | 19.6 | 0.7 | 10.9 | $0.6 |
| 🇸🇪 Sweden | 65.0 | 22.5 | 1.3 | 11.3 | $0.6 |
| 🇮🇱 Israel | 72.4 | 17.2 | 1.3 | 9.1 | $0.5 |
| 🇦🇷 Argentina | 52.5 | 23.6 | 7.1 | 16.8 | $0.5 |
| 🇦🇹 Austria | 62.4 | 25.8 | 1.2 | 10.5 | $0.5 |
| 🇳🇬 Nigeria | 43.8 | 31.4 | 23.4 | 1.4 | $0.5 |
| 🇹🇭 Thailand | 56.3 | 35.0 | 8.7 | 0.0 | $0.5 |
| 🇮🇪 Ireland | 55.4 | 37.8 | 1.0 | 5.8 | $0.5 |
| 🇭🇰 Hong Kong | 89.7 | 6.0 | 0.1 | 4.3 | $0.4 |
| 🇩🇰 Denmark | 66.7 | 19.3 | 0.9 | 13.1 | $0.4 |
| 🇸🇬 Singapore | 70.3 | 24.4 | 0.0 | 5.3 | $0.4 |
| 🇿🇦 South Africa | 63.0 | 24.5 | 2.5 | 10.0 | $0.4 |
| 🇵🇭 Philippines | 61.0 | 28.9 | 10.1 | 0.0 | $0.4 |
| 🇪🇬 Egypt | 52.5 | 31.2 | 11.4 | 4.9 | $0.4 |
| 🇧🇩 Bangladesh | 51.3 | 33.3 | 11.6 | 3.7 | $0.4 |
| 🇳🇴 Norway | 51.8 | 36.3 | 1.7 | 10.2 | $0.4 |
| 🇻🇳 Vietnam | 41.2 | 37.5 | 12.6 | 8.8 | $0.4 |
| 🇲🇾 Malaysia | 51.6 | 37.8 | 9.6 | 1.1 | $0.4 |
| 🇦🇪 U.A.E. | 51.6 | 47.5 | 0.9 | 0.0 | $0.4 |
| 🇵🇰 Pakistan | 52.1 | 18.8 | 22.7 | 6.4 | $0.3 |
| 🇵🇹 Portugal | 64.7 | 19.6 | 2.2 | 13.5 | $0.3 |
| 🇫🇮 Finland | 60.3 | 24.1 | 2.3 | 13.4 | $0.3 |
| 🇨🇴 Colombia | 58.0 | 24.9 | 7.6 | 9.5 | $0.3 |
| 🇷🇴 Romania | 59.1 | 26.7 | 4.5 | 9.6 | $0.3 |
| 🇨🇿 Czechia | 58.8 | 30.3 | 1.8 | 9.1 | $0.3 |
| 🇨🇱 Chile | 54.4 | 31.3 | 3.6 | 10.6 | $0.3 |
| 🇳🇿 New Zealand* | 65.6 | 20.4 | 5.7 | 8.4 | $0.2 |
Industrial sector includes construction. Agriculture sector includes forestry and fishing. *Data as of 2019.
In the U.S., services make up nearly 78% of GDP. Apart from Hong Kong, it comprises the highest share of GDP across the world’s largest economies. Roughly 80% of American jobs in the private sector are in services, spanning from healthcare and entertainment to finance and logistics.
Like America, a growing share of China’s GDP is from services, contributing to almost 54% of total economic output, up from 44% in 2010. This can be attributed to rising incomes and higher productivity in the sector as the economy has grown and matured, among other factors.
In a departure from the top 10 biggest countries globally, agriculture continues to drive a large portion of India’s GDP. India is the world’s second largest producer of wheat and rice, with agriculture accounting for 44% of the country’s employment.
While the services sector has grown in India, it makes up a greater share in other emerging economies such as Brazil (58%), Mexico (59%), and the Philippines (61%).
Growth Dynamics
Services-led growth has risen faster than manufacturing across many developing nations, underpinned by productivity growth.
This structural shift is seen across economies. In many countries in Africa, for instance, jobs have increasingly moved from agriculture to services and trade, where it now accounts for 42% of jobs.
These growth patterns are supported by rising incomes in developing economies, while innovation in tech is lowering barriers to enabling service growth. As the industrial sector makes up a lower share of trade and economic activity, the service sector is projected to make up 77% of global GDP by 2035.

This article was published as a part of Visual Capitalist's Creator Program, which features data-driven visuals from some of our favorite Creators around the world.


Markets
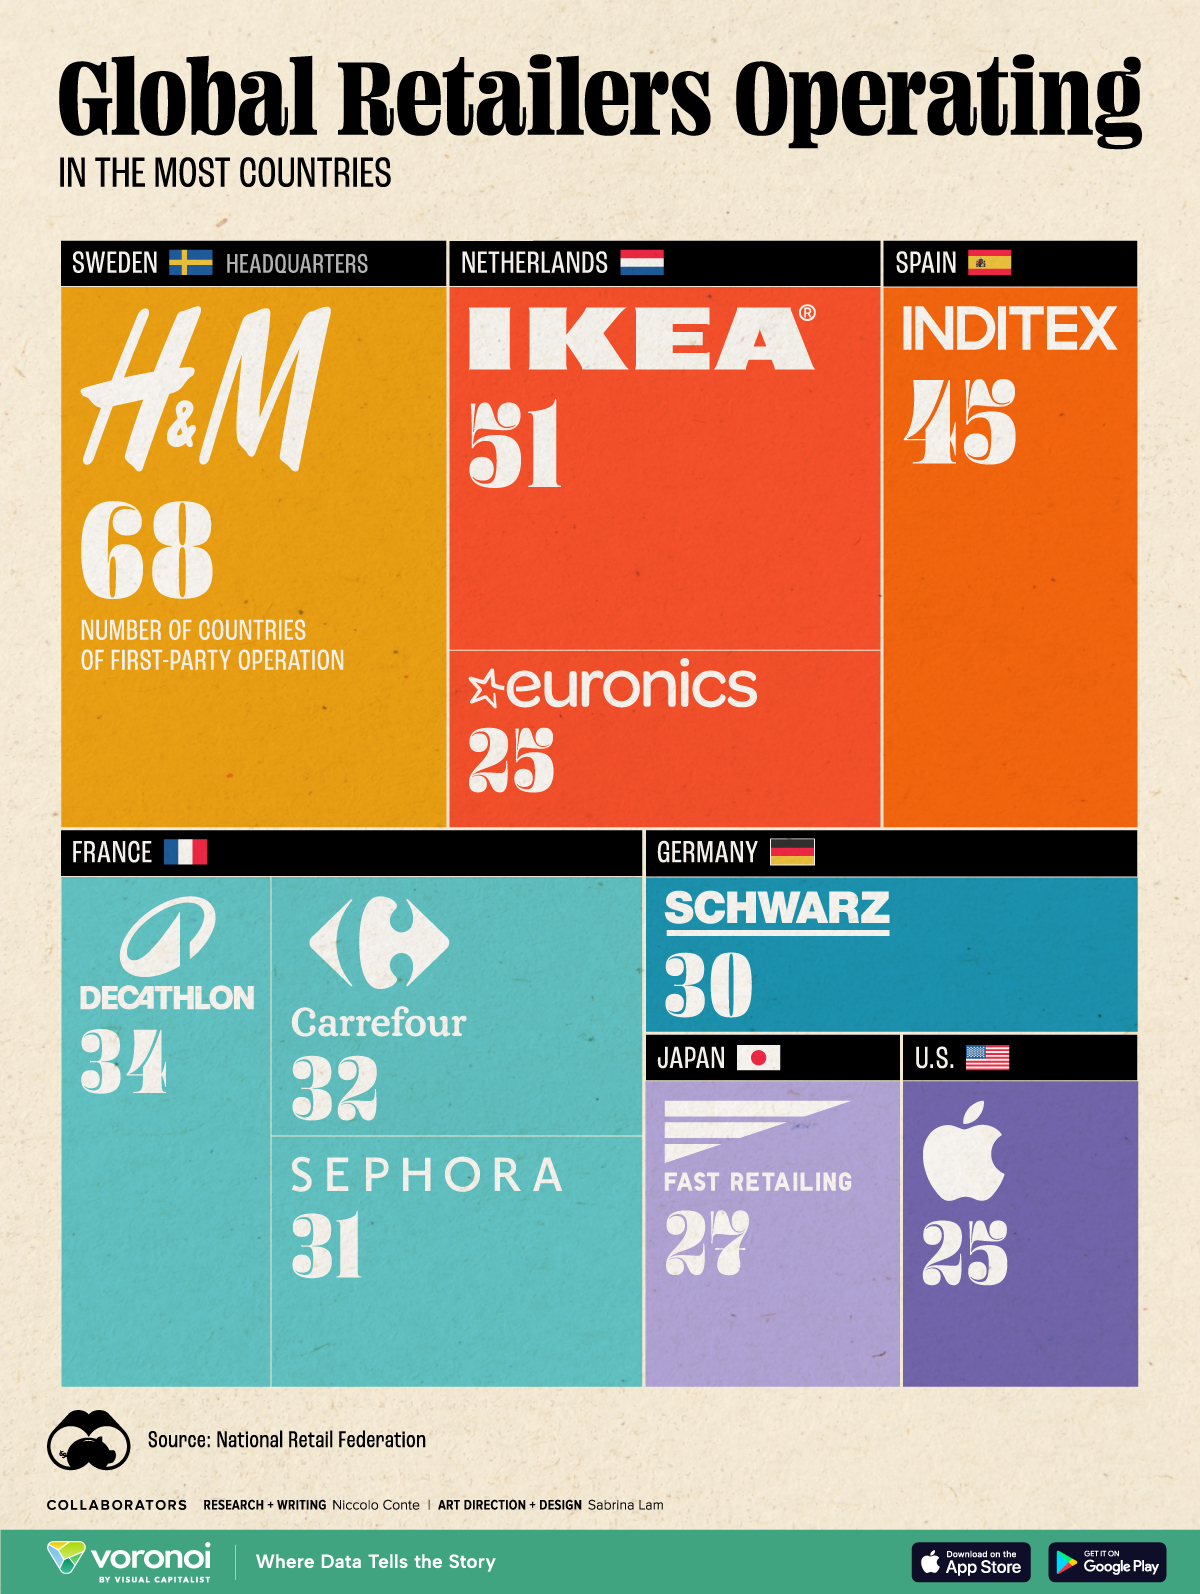
Which Retailers Operate in the Most Countries?
From fast-fashion giant H&M to Apple, we show the top retailers globally with the largest international presence.
The Top Retailers Operating in the Most Countries
This was originally posted on our Voronoi app. Download the app for free on iOS or Android and discover incredible data-driven charts from a variety of trusted sources.
Today, international expansion is a key growth strategy for the world’s top retailers as companies target untapped markets with the highest potential to drive revenue and profit streams.
While traditional retailers have sought out digital strategies as the industry evolves and consumer behaviors change, physical storefronts continue to be a dominant driver of retail sales. In 2023, brick-and-mortar sales comprised 81% of retail sales globally.
This graphic shows the top retailers operating in the most markets worldwide, based on data from the National Retail Federation.
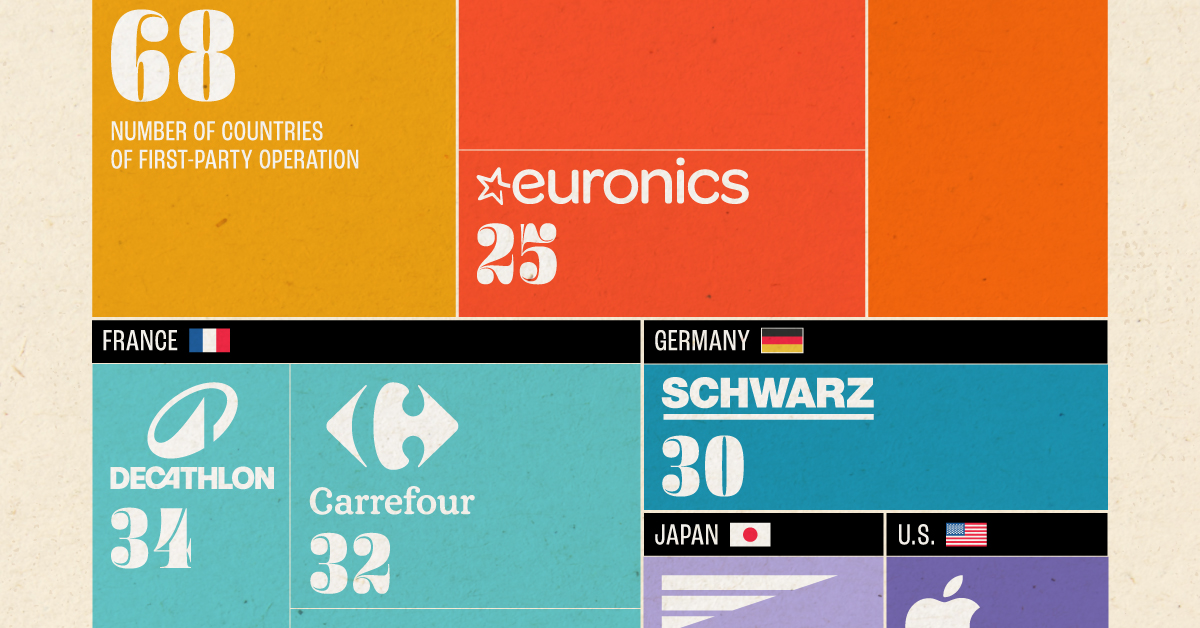
Global Retailers With the Largest International Footprint
Here are the global retailers with the widest-reaching presence around the world in 2023:
| Ranking | Retailer | Number of Countries of First-Party Operation | Headquarters |
|---|---|---|---|
| 1 | H&M | 68 | 🇸🇪 Sweden |
| 2 | IKEA | 51 | 🇳🇱 Netherlands |
| 3 | Inditex | 45 | 🇪🇸 Spain |
| 4 | Decathlon | 34 | 🇫🇷 France |
| 5 | Carrefour | 32 | 🇫🇷 France |
| 6 | Sephora (LVMH) | 31 | 🇫🇷 France |
| 7 | Schwarz Group | 30 | 🇩🇪 Germany |
| 8 | Fast Retailing | 27 | 🇯🇵 Japan |
| 9 | Euronics International | 25 | 🇳🇱 Netherlands |
| 10 | Apple | 25 | 🇺🇸 U.S. |
Notably, eight of the top 10 companies with the widest market reach hail from Europe.
Fast-fashion giant H&M ranks first overall, with 4,454 stores across 68 countries last year. In 2023, the Swedish company earned $21.6 billion in revenues, with its largest markets by number of store locations being the U.S., Germany, and the UK. This year, it plans to open 100 new stores in growth markets, along with shutting down 160 stores in established locations, ultimately decreasing its global store count.
In second is IKEA, with a presence in 51 countries. Last year, the company expanded its footprint in India, launching its first store in the tech hub, Hyderabad. While the company has a broad international reach, its number of storefronts is a fraction of H&M, at 477 total stores worldwide.
Looking beyond the continent, Japan’s Fast Retailing is the top retailer in Asia, operating in 27 countries globally. As the parent company to fashion brand Uniqlo, it also stands as the seventh most valuable listed firm by market capitalization in the country.
Additionally, Apple is the sole American company to make this list, with storefronts in 25 countries. Overall, the company operates four types of retail stores: regular, AppleStore+, flagships, and flagship+. Regular stores often earn $40 million annually, while flagship+ stores typically earn more than $100 million.
By 2027, the company plans to build or remodel 53 stores globally, with the majority located in the U.S. and China.

-

 Maps1 week ago
Mapped: The Top Exports in Asian Countries
-

 Demographics2 weeks ago
Mapped: U.S. Immigrants by Region
-

 Healthcare2 weeks ago
Which Countries Have the Highest Infant Mortality Rates?
-

 Politics2 weeks ago
Charted: How Americans Feel About Federal Government Agencies
-

 Mining2 weeks ago
Visualizing Copper Production by Country in 2023
-

 Culture2 weeks ago
How Popular Snack Brand Logos Have Changed
-

 Misc2 weeks ago
Visualized: Aircraft Carriers by Country
-

 United States2 weeks ago
Mapped: Countries Where Recreational Cannabis is Legal