Markets
Charted: The Rise and Fall of WeWork


Charted: The Rise and Fall of WeWork
Despite its recommitment to core business fundamentals in the last few years, WeWork’s management—which saw a shakeup in May 2023 when CEO Sandeep Mathrani departed—is setting off a signal flare about the company’s future.
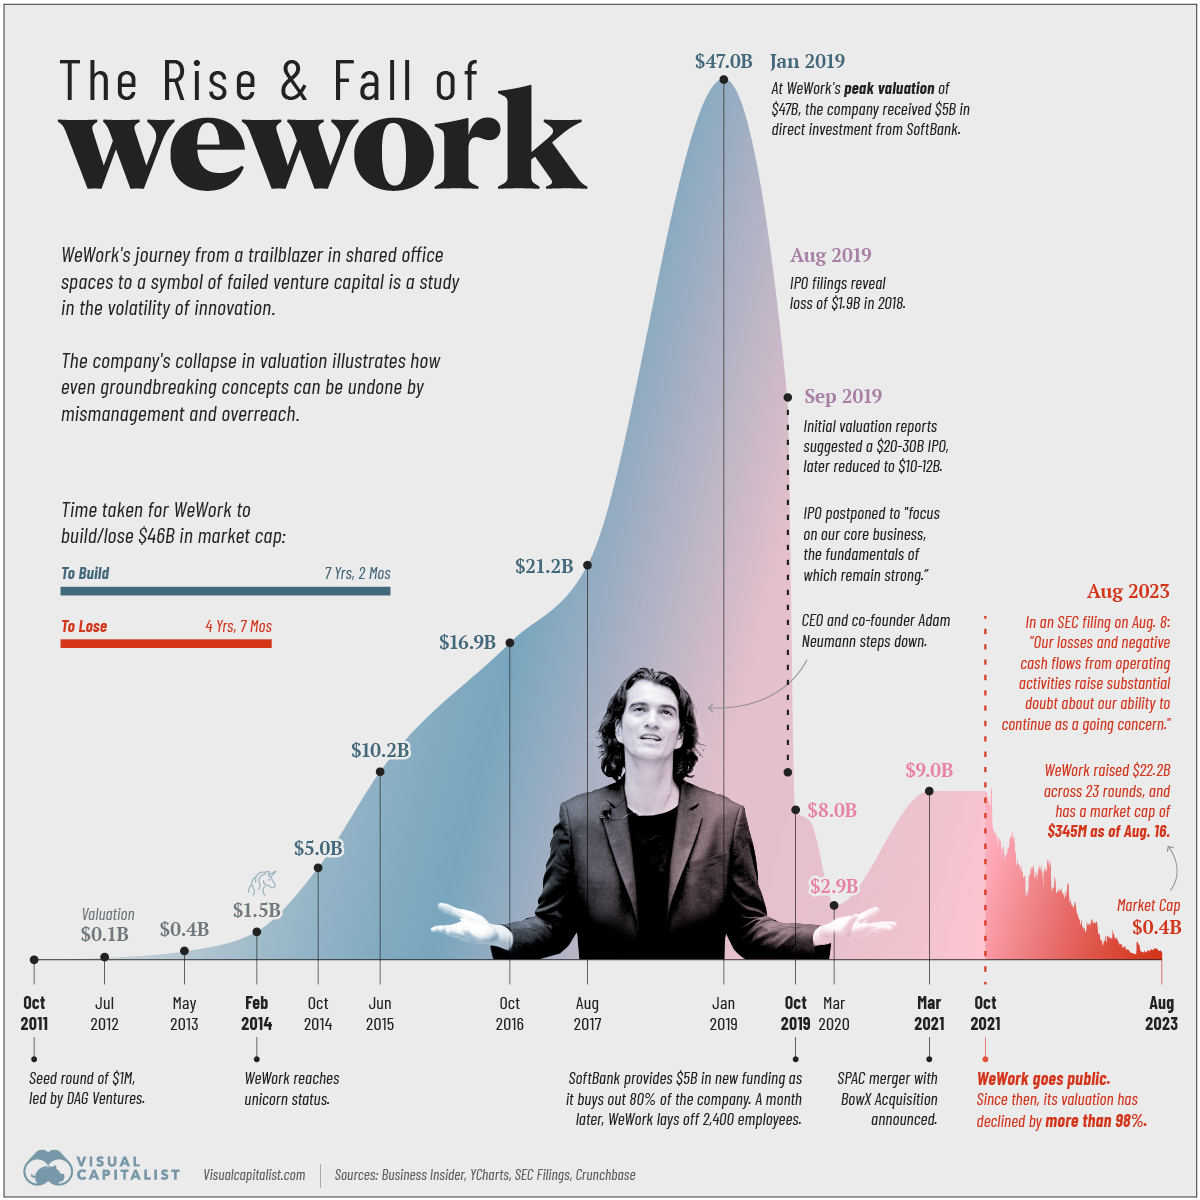
“Our losses and negative cash flows from operating activities raise substantial doubt about our ability to continue as a going concern.” — WeWork, SEC filing, August 8th, 2023.
But how did the once-poster child of Silicon Valley end up seeing its valuation collapse more than 99% from its peak?
Pulling together data from Business Insider, YCharts, SEC Filings, and Crunchbase we follow the rise and fall of WeWork since 2011.
The Rise of WeWork: 2010–2019
WeWork was founded in 2010 by Adam Neumann and Miguel McKelvey with the primary objective of providing shared workspaces catered to freelancers, startups, and companies seeking “flexible office solutions.”
The business model, which rested on renting space from developers long-term, renovating and parceling the property, and subsequently leasing it out to short-term clients, thrived in a decade of low interest rates.
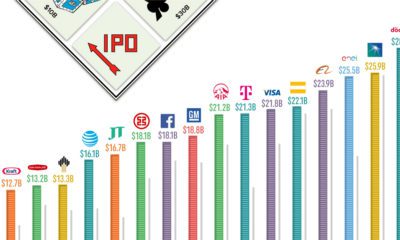
Its valuation surpassed $1 billion in 2014, earning the coveted “unicorn” status. In 2017, SoftBank Group made the first of its total $18.5 billion investment in the company. Two years later, WeWork hit a peak valuation of $47 billion with SoftBank’s continued investments, raising expectations for an imminent IPO.
| Date | WeWork's Valuation |
|---|---|
| October, 2011 | n/a |
| July, 2012 | $97 million |
| May, 2013 | $440 million |
| February, 2014 | $1.5 billion |
| October, 2014 | $5.0 billion |
| June, 2015 | $10.2 billion |
| October, 2016 | $16.9 billion |
| August, 2017 | $21.2 billion |
| January, 2019 | $47.0 billion |
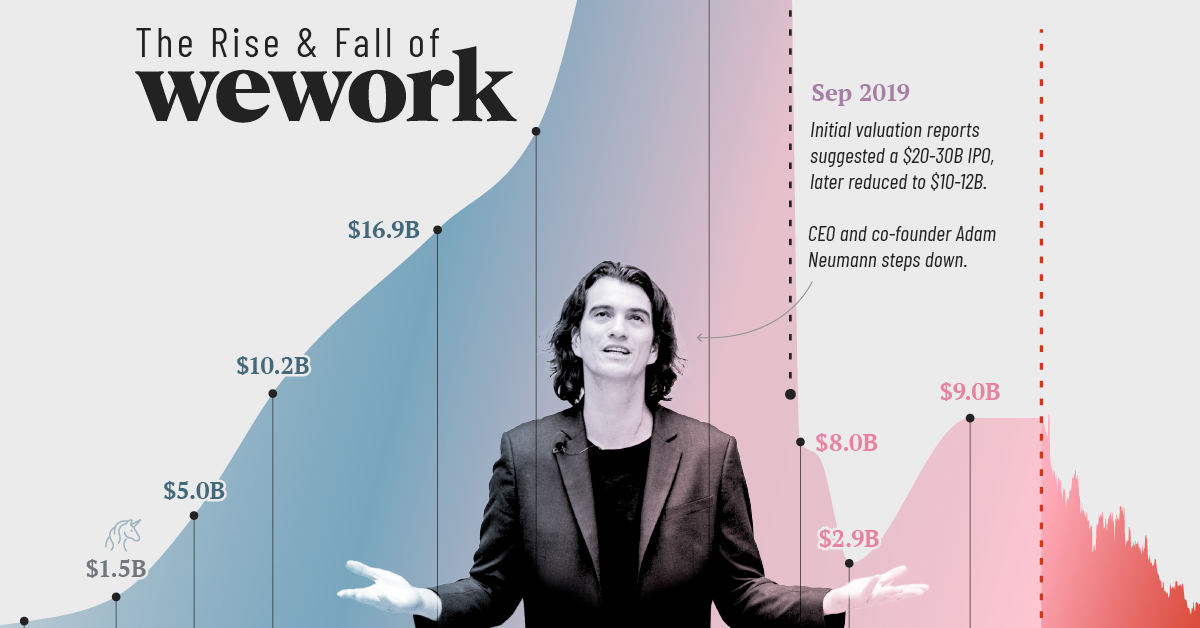
| August, 2019 | $20-30 billion |
| September, 2019 | $10-12 billion |
| October, 2019 | $8.0 billion |
| December, 2019 | $7.3 billion* |
| March, 2020 | $2.9 billion* |
| March, 2021 | $9.0 billion |
| October, 2021 | $9.0 billion |
| August, 2023 | $0.4 billion |
Footnote: *SoftBank valuation is based on discounted cash flow method.
The Fall of WeWork: 2019–2023
Intensive scrutiny fueled by the impending IPO raised several questions for the company. These included concerns around Neumann’s leadership style, excessive spending, creative accounting, and conflicts of interest leading to Neumann’s resignation and delay of the IPO.
In October 2019, SoftBank Group acquired 80% of the company with $5 billion of additional funding. A month later WeWork laid off 2,400 employees, nearly one-fifth of its workforce.
Real estate veteran Sandeep Mathrani was made CEO in 2020, tasked with turning the company around by eliminating recurring costs and restructuring its debt.
That same year the COVID-19 pandemic forced a significant shift to remote work, causing a decline in office space demand. WeWork’s business model, focused on shared physical spaces, faced a substantial challenge.
In 2021, WeWork went public through a SPAC merger, aiming to regain investor trust. The listing reflected a revised strategy focusing on key markets, cost optimization, and a pivot toward catering to larger corporate clients with hybrid work needs.
Over the past two years, its market capitalization as a publicly-traded company has plummeted from $9 billion to under half a billion dollars. WeWork disclosed $11.4 billion in net losses from 2020 through to June 30th, 2023 in their recent SEC filing.
What Happened to WeWork?
Aside from the trials and tribulations of former CEO Adam Neumann, the company’s sustainability itself has been questioned several times over the past decade. In 2019, the Guardian summarized the criticism succinctly by saying, the company was “renting long and subleasing short,” which left it “exposed to risk.”
Post-pandemic, the proliferation of work-from-home policies, along with the rapid rise in global interest rates in the last year—which can reduce cash flows for the commercial real estate industry—have magnified those risks.
WeWork is now battling an environment of excess supply, softer demand, increased competition and macroeconomic volatility, according to interim CEO David Tolley.
“It was foolish of me to invest in WeWork. I was wrong.” — Masayoshi Son, SoftBank Group founder.
The New York Times says that WeWork has more than 18 million square feet of rentable office space in the U.S. and Canada alone and that its failure could have a “sizable impact” on the commercial real estate industry.
At the same time, the Times notes that reporting the “substantial doubt” on continued business operations might help the company buy time with lenders to seek additional capital through issuance of debt, equity, or the sale of assets.


Markets
What History Reveals About Interest Rate Cuts
How have previous cycles of interest rate cuts in the U.S. impacted the economy and financial markets?
What History Reveals About Interest Rate Cuts
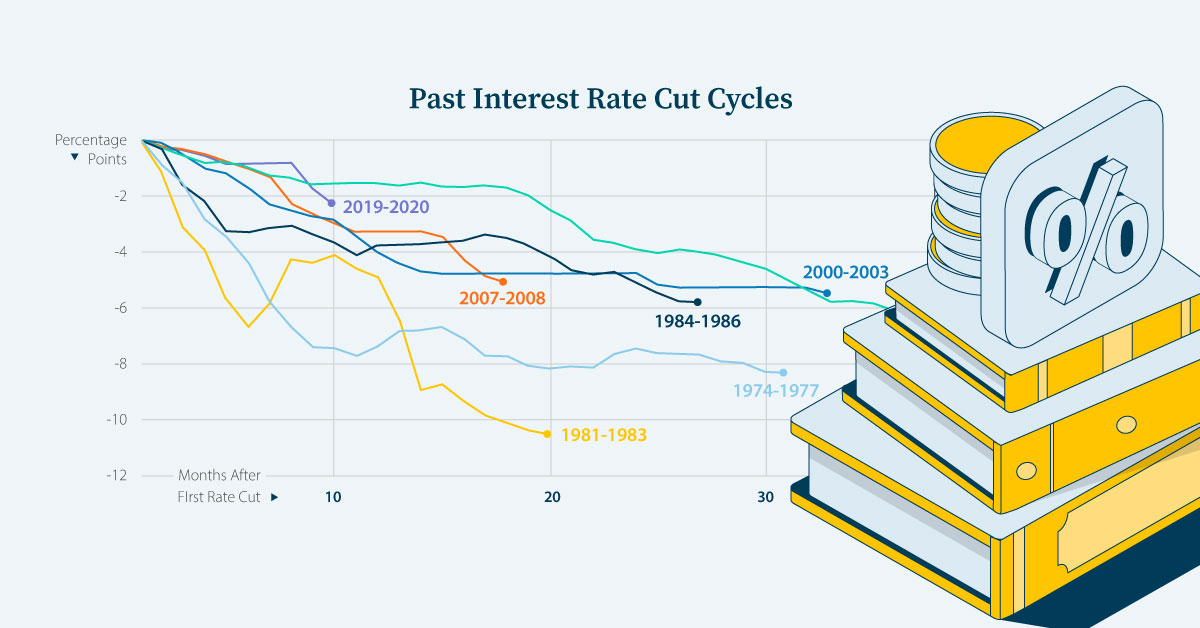
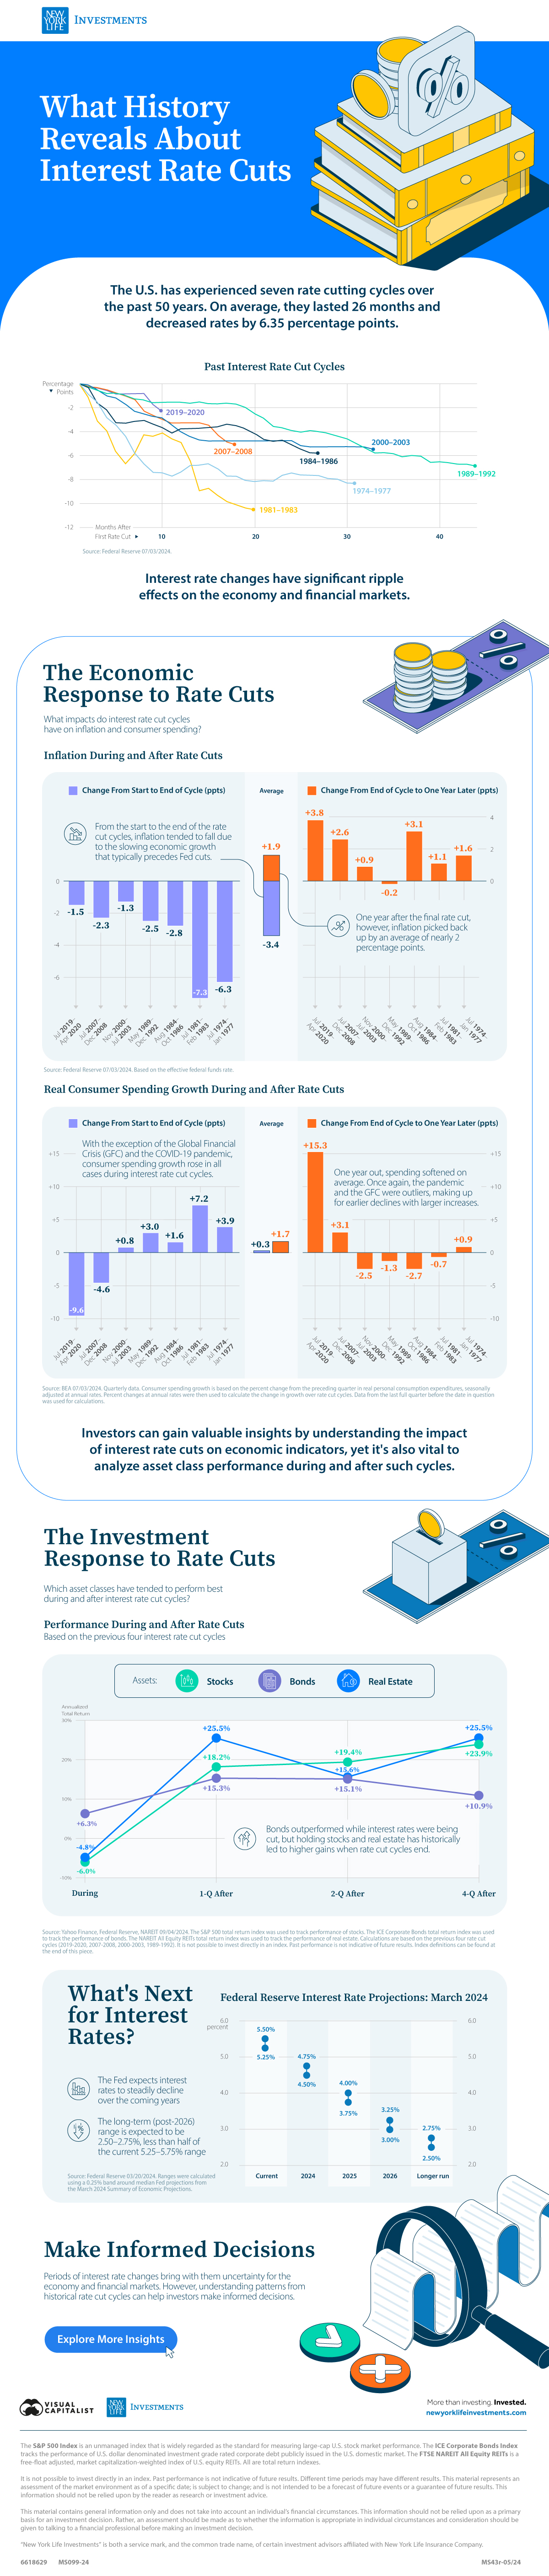
The Federal Reserve has overseen seven cycles of interest rate cuts, averaging 26 months and 6.35 percentage points (ppts) each.
We’ve partnered with New York Life Investments to examine the impact of interest rate cut cycles on the economy and on the performance of financial assets in the U.S. to help keep investors informed.
A Brief History of Interest Rate Cuts
Interest rates are a powerful tool that the central bank can use to spur economic activity.
Typically, when the economy experiences a slowdown or a recession, the Federal Reserve will respond by cutting interest rates. As a result, each of the previous seven rate cut cycles—shown in the table below—occurred during or around U.S. recessions, according to data from the Federal Reserve.
| Interest Rate Cut Cycle | Magnitude (ppts) |
|---|---|
| July 2019–April 2020 | -2.4 |
| July 2007–December 2008 | -5.1 |
| November 2000–July 2003 | -5.5 |
| May 1989–December 1992 | -6.9 |
| August 1984–October 1986 | -5.8 |
| July 1981–February 1983 | -10.5 |
| July 1974–January 1977 | -8.3 |
| Average | -6.4 |
Source: Federal Reserve 07/03/2024
Understanding past economic and financial impacts of interest rate cuts can help investors prepare for future monetary policy changes.
The Economic Response: Inflation
During past cycles, data from the Federal Reserve, shows that, on average, the inflation rate continued to decline throughout (-3.4 percentage points), largely due to the lagged effects of a slower economy that normally precedes interest rate declines.
| Cycle | Start to end change (ppts) | End to one year later (ppts) |
|---|---|---|
| July 2019–April 2020 | -1.5 | +3.8 |
| July 2007–December 2008 | -2.3 | +2.6 |
| November 2000–July 2003 | -1.3 | +0.9 |
| May 1989–December 1992 | -2.5 | -0.2 |
| August 1984–October 1986 | -2.8 | +3.1 |
| July 1981–February 1983 | -7.3 | +1.1 |
| July 1974–January 1977 | -6.3 | +1.6 |
| Average | -3.4 | +1.9 |
Source: Federal Reserve 07/03/2024. Based on the effective federal funds rate. Calculations are based on the previous four rate cut cycles (2019-2020, 2007-2008, 2000-2003, 1989-1992, 1984-1986, 1981-1983, 1974-1977).
However, inflation played catch-up and rose by +1.9 percentage points one year after the final rate cut. With lower interest rates, consumers were incentivized to spend more and save less, which led to an uptick in the price of goods and services in six of the past seven cycles.
The Economic Response: Real Consumer Spending Growth
Real consumer spending growth, as measured by the Bureau of Economic Analysis, typically reacted to rate cuts more quickly.
On average, consumption growth rose slightly during the rate cut periods (+0.3 percentage points) and that increase accelerated one year later (+1.7 percentage points).
| Cycle | Start to end (ppts) | End to one year later (ppts) |
|---|---|---|
| July 2019–April 2020 | -9.6 | +15.3 |
| July 2007–December 2008 | -4.6 | +3.1 |
| November 2000–July 2003 | +0.8 | -2.5 |
| May 1989–December 1992 | +3.0 | -1.3 |
| August 1984–October 1986 | +1.6 | -2.7 |
| July 1981–February 1983 | +7.2 | -0.7 |
| July 1974–January 1977 | +3.9 | +0.9 |
| Average | +0.3 | +1.7 |
Source: BEA 07/03/2024. Quarterly data. Consumer spending growth is based on the percent change from the preceding quarter in real personal consumption expenditures, seasonally adjusted at annual rates. Percent changes at annual rates were then used to calculate the change in growth over rate cut cycles. Data from the last full quarter before the date in question was used for calculations. Calculations are based on the previous four rate cut cycles (2019-2020, 2007-2008, 2000-2003, 1989-1992, 1984-1986, 1981-1983, 1974-1977).
The COVID-19 pandemic and the Global Financial Crisis were outliers. Spending continued to fall during the rate cut cycles but picked up one year later.
The Investment Response: Stocks, Bonds, and Real Estate
Historically, the trend in financial asset performance differed between stocks, bonds, and real estate both during and after interest rate declines.
Stocks and real estate posted negative returns during the cutting phases, with stocks taking the bigger hit. Conversely, bonds, a traditional safe haven, gained ground.
| Asset | During (%) | 1 Quarter After (%) | 2 Quarters After (%) | 4 Quarters After (%) |
|---|---|---|---|---|
| Stocks | -6.0 | +18.2 | +19.4 | +23.9 |
| Bonds | +6.3 | +15.3 | +15.1 | +10.9 |
| Real Estate | -4.8 | +25.5 | +15.6 | +25.5 |
Source: Yahoo Finance, Federal Reserve, NAREIT 09/04/2024. The S&P 500 total return index was used to track performance of stocks. The ICE Corporate Bonds total return index was used to track the performance of bonds. The NAREIT All Equity REITs total return index was used to track the performance of real estate. Calculations are based on the previous four rate cut cycles (2019-2020, 2007-2008, 2000-2003, 1989-1992). It is not possible to invest directly in an index. Past performance is not indicative of future results. Index definitions can be found at the end of this piece.
However, in the quarters preceding the last rate cut, all three assets increased in value. One year later, real estate had the highest average performance, followed closely by stocks, with bonds coming in third.
What’s Next for Interest Rates
In March 2024, the Federal Reserve released its Summary of Economic Projections outlining its expectation that U.S. interest rates will fall steadily in 2024 and beyond.
| Year | Range (%) | Median (%) |
|---|---|---|
| Current | 5.25-5.50 | 5.375 |
| 2024 | 4.50-4.75 | 4.625 |
| 2025 | 3.75-4.0 | 3.875 |
| 2026 | 3.00-3.25 | 3.125 |
| Longer run | 2.50-2.75 | 2.625 |
Source: Federal Reserve 20/03/2024
Though the timing of interest rate cuts is uncertain, being armed with the knowledge of their impact on the economy and financial markets can provide valuable insight to investors.
Explore more insights from New York Life Investments.

-

 Markets3 days ago
Which Retailers Operate in the Most Countries?
From fast-fashion giant H&M to Apple, we show the top retailers globally with the largest international presence.
-

 Maps1 week ago
Mapped: The 10 U.S. States With the Lowest Real GDP Growth
In this graphic, we show where real GDP lagged the most across America in 2023 as high interest rates weighed on state economies.
-

 Venture Capital1 week ago
Ranked: The World’s 50 Largest Private Equity Firms
In this graphic, we show the largest private equity firms in the world—from titan Blackstone to China’s leading alternative funds.
-

 Debt1 week ago
Top 10 Countries Most in Debt to the IMF
Argentina tops the ranking, with a debt equivalent to 5.3% of the country’s GDP.
-

 Markets1 week ago
Ranked: The Top 6 Economies by Share of Global GDP (1980-2024)
Gain a unique perspective on the world’s economic order from this graphic showing % share of global GDP over time.
-

 Economy3 weeks ago
Mapped: Europe’s GDP Per Capita, by Country
Which European economies are richest on a GDP per capita basis? This map shows the results for 44 countries across the continent.

-

 Economy1 week ago
Mapped: The Top Exports in Asian Countries
-

 Maps2 weeks ago
Mapped: U.S. Immigrants by Region
-

 Healthcare2 weeks ago
Which Countries Have the Highest Infant Mortality Rates?
-

 Misc2 weeks ago
Charted: How Americans Feel About Federal Government Agencies
-

 Mining2 weeks ago
Visualizing Copper Production by Country in 2023
-

 Brands2 weeks ago
How Popular Snack Brand Logos Have Changed
-

 War2 weeks ago
Visualized: Aircraft Carriers by Country
-

 United States2 weeks ago
Mapped: Countries Where Recreational Cannabis is Legal