Technical Analysis – USDCAD retreats to 9-month low, confirming bearish breakout
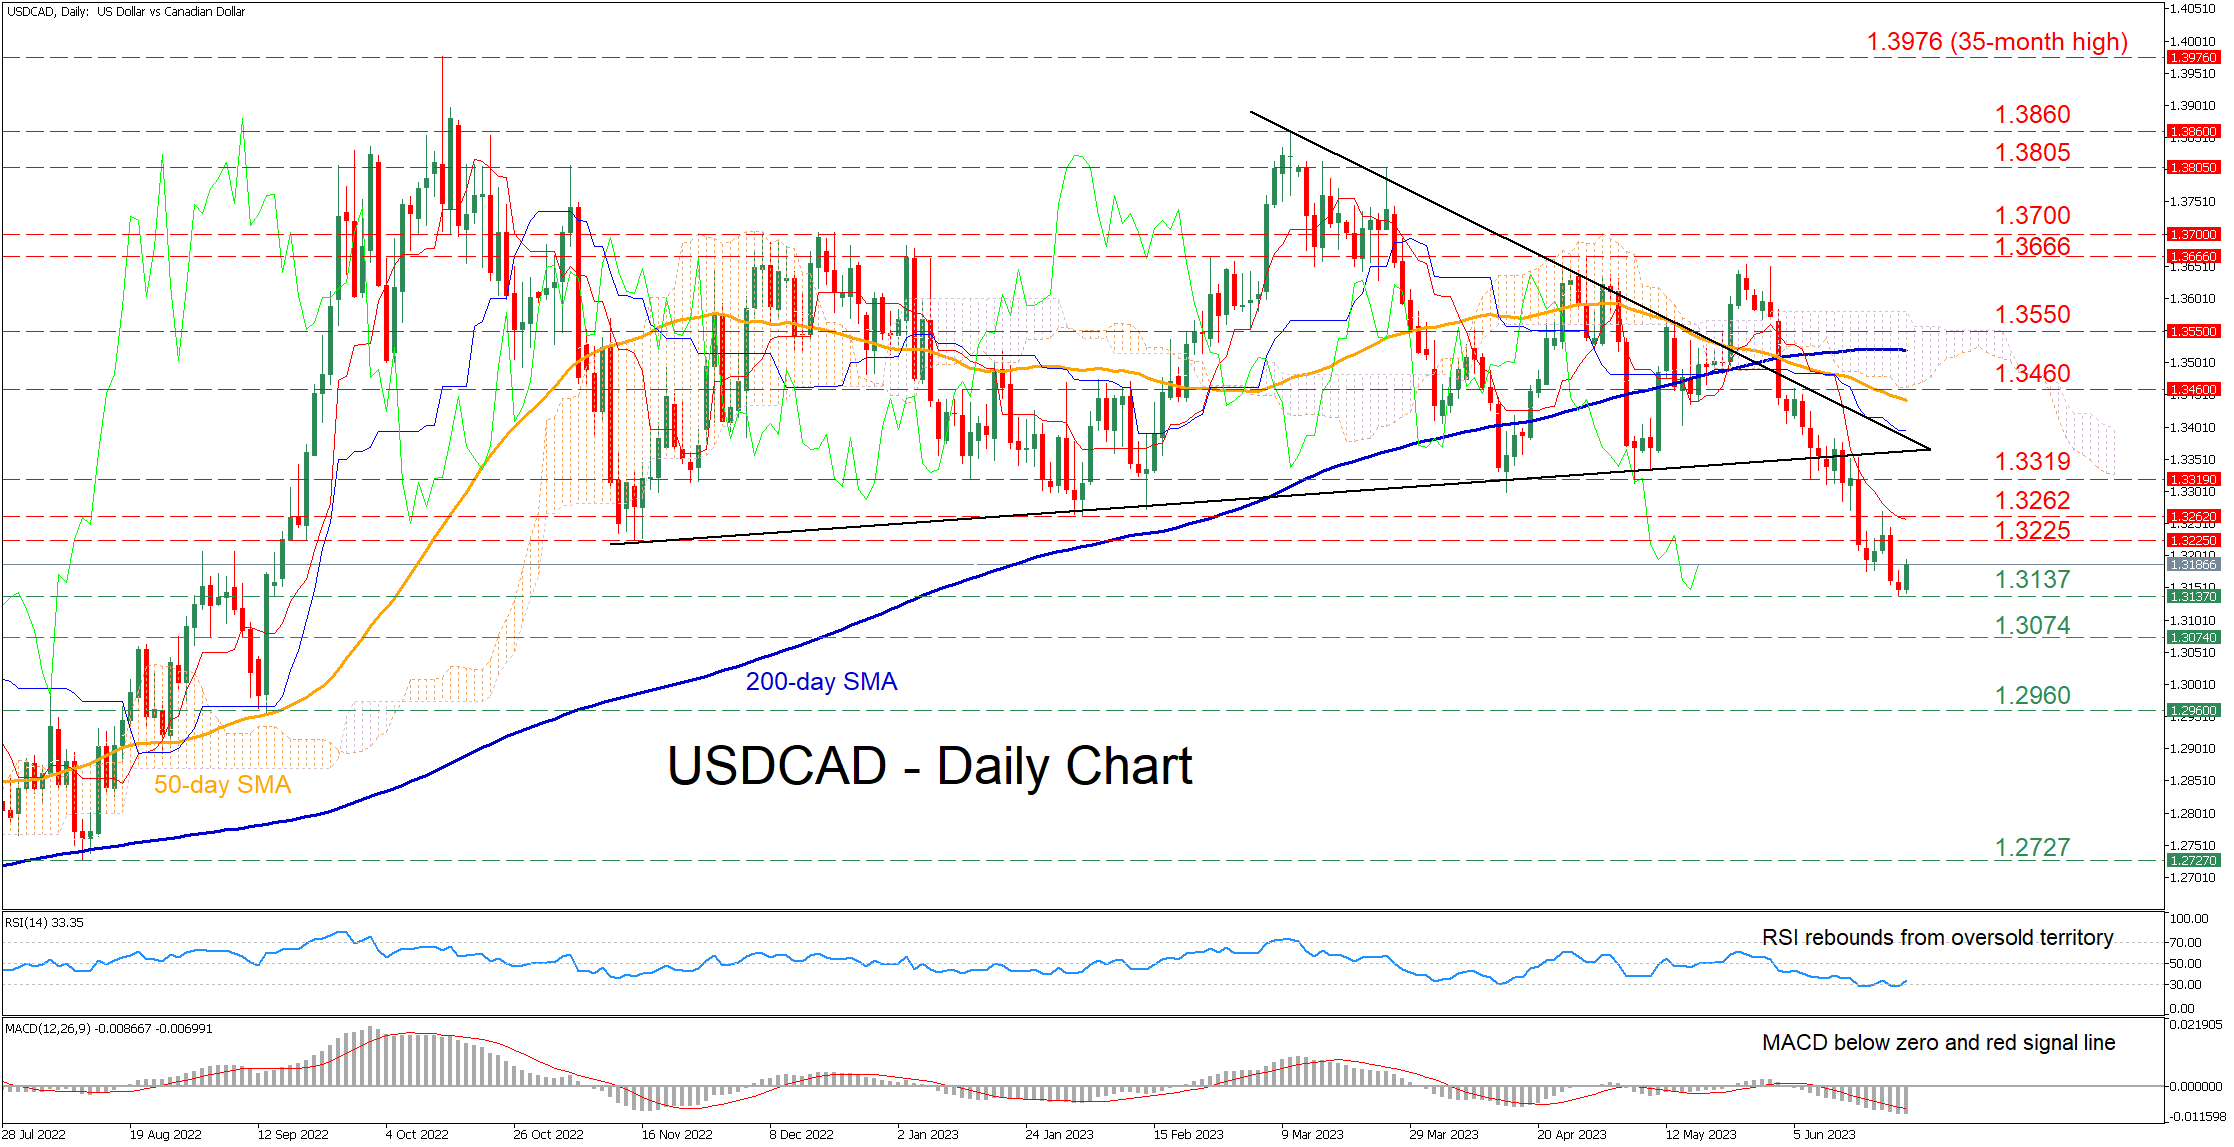
USDCAD has been in a steady downtrend since late May, generating a clear structure of lower highs and lower lows. Moreover, the technical picture deteriorated even further when the price broke below the base of the symmetrical triangle pattern, which triggered a massive decline towards a fresh 9-month low of 1.3137.
The momentum indicators currently suggest that near-term risks are tilted to the downside. Specifically, the RSI bounced off the oversold zone but remains deep in the negative territory, while the MACD is holding below both zero and its red signal line.
Should the bears try to push the price lower, initial support could be met at the recent 9-month low of 1.3137. Piercing that wall, the pair could dive towards 1.3074 or lower to challenge the September 2022 bottom of 1.2960. Further declines could then come to a halt at the August 2022 low of 1.2727.
On the flipside, if the price reverses to the upside, a bunch of previous support levels could serve as resistance in the future. More precisely, the pair could advance towards the November 2022 support of 1.3225 before the February low of 1.3262 gets tested. Even higher, the May support of 1.3319 may curb any upside attempts.
In brief, USDCAD has been on a steep decline after breaking below the base of its recent triangle pattern. Moving forward, traders could shift their attention towards the 1.3000 psychological mark.
Related Assets
Latest News
Disclaimer: The XM Group entities provide execution-only service and access to our Online Trading Facility, permitting a person to view and/or use the content available on or via the website, is not intended to change or expand on this, nor does it change or expand on this. Such access and use are always subject to: (i) Terms and Conditions; (ii) Risk Warnings; and (iii) Full Disclaimer. Such content is therefore provided as no more than general information. Particularly, please be aware that the contents of our Online Trading Facility are neither a solicitation, nor an offer to enter any transactions on the financial markets. Trading on any financial market involves a significant level of risk to your capital.
All material published on our Online Trading Facility is intended for educational/informational purposes only, and does not contain – nor should it be considered as containing – financial, investment tax or trading advice and recommendations; or a record of our trading prices; or an offer of, or solicitation for, a transaction in any financial instruments; or unsolicited financial promotions to you.
Any third-party content, as well as content prepared by XM, such as: opinions, news, research, analyses, prices and other information or links to third-party sites contained on this website are provided on an “as-is” basis, as general market commentary, and do not constitute investment advice. To the extent that any content is construed as investment research, you must note and accept that the content was not intended to and has not been prepared in accordance with legal requirements designed to promote the independence of investment research and as such, it would be considered as marketing communication under the relevant laws and regulations. Please ensure that you have read and understood our Notification on Non-Independent Investment. Research and Risk Warning concerning the foregoing information, which can be accessed here.