


Talking Points
-Japanese fiscal stimulus is anticipated to be announced Thursday night into Friday morning
-USD/JPY has overlapped July 21 low signifying the medium term bias is bullish
-Follow shifts in sentiment for clues on the near term direction of USD/JPY
The next 24-36 hours may see some volatile price swings for USD/JPY. Bank of Japan is scheduled to release their latest round of monetary statements and which may include additional measures of stimulus.
We previously wrote how the medium term bias for USD/JPY is bullish. Tuesday’s break above 105.42 creates overlap with the July 21 low. That overlap is significant because it suggests the move from 107.49 to 103.99 was a corrective consolidation and the prices may fully retrace to above 107.49 in the coming weeks.
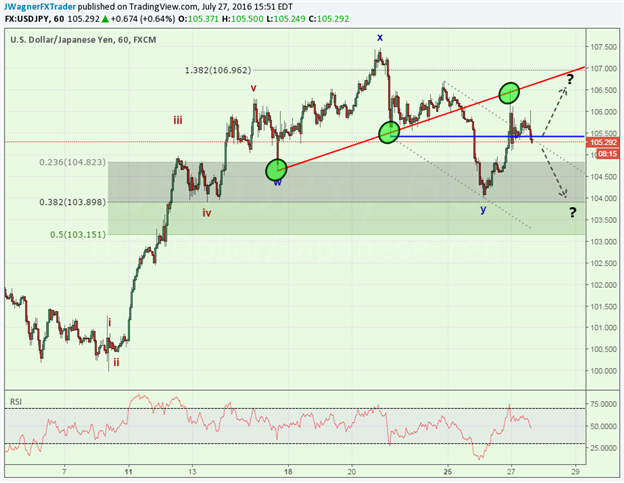
The pattern that stands out right now is that we have a 5 wave impulsive move from July 8 to July 14 to start a new uptrend. According to Elliott Wave theory, there are two other patterns that start off a new trend with a five wave move and both of those patterns are followed by another move of similar size. Therefore, once support is formed, we can target another 600 pip move higher as that was the distance of the July 8-14 trend.
Should prices find support and move higher, the next top side level of resistance comes in near 106.72 then 107.50. Above these levels opens the door towards 111.
If prices continue to consolidate lower, consider the previous swing lows near 104.00 as support.
From a sentiment perspective, the growth in short traders has been slowing down from the recent 10 month high. The current SSI reading is +1.38 which is slightly lower than yesterday and still favors the bulls. However, if less traders become interested to the short side, then that could indicate top side potential is waning. Use the shifts in SSI to provide near term clues on price direction. See live trader positioning on USD/JPY here.
Suggested Reading: Bulls Aren't Out of the Woods Yet
Are you familiar with one of the biggest mistake traders make? Find out what it is and how to overcome it here.
Interested in a quarterly outlook for USD and/or JPY? Download our quarterly forecast here.
---Written by Jeremy Wagner, Head Trading Instructor, DailyFX EDU
Follow me on Twitter at @JWagnerFXTrader .
See Jeremy’s recent articles at his Bio Page.
To receive additional articles from Jeremy via email, join Jeremy’s distribution list.


