EUR/USD continued its upside run, tackling the 1.10 level but struggling with the highs and eventually closing close to levels seen in the previous week. The upcoming week features inflation numbers and more PMIs. Here is an outlook for the highlights of this week and an updated technical analysis for EUR/USD.
Better than expected German manufacturing PMI helped the euro, and so did the better than expected German IFO business climate. Draghi repeated this regular messages and made an effort not to rock the boat. In the US, inflation beat expectations and so did new home sales. These and some hawkish comments halted the dollar’s dive, but the greenback still suffered from some weak data, namely durable goods orders.
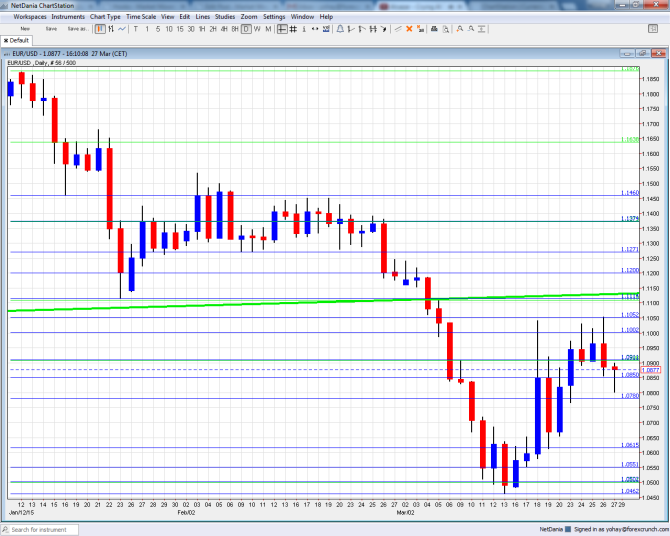
[do action=”autoupdate” tag=”EURUSDUpdate”/]EUR/USD daily chart with support and resistance lines on it. Click to enlarge:
- German CPI: Monday, states report during the day, final figure at 12:00. After a big plunge in January, the consolidation of oil prices sent German CPI up 0.9% m/m. Nevertheless, Germany is not really out of the deflation zone y/y. A small rise of 0.4% is expected m/m in the preliminary number for March.
- Spanish Flash CPI: Monday, 7:00. The zone’s fourth largest economy has seen y/y falls for long months. In February, the level of deflation softened to fall of 1.1%. The fall in Spanish prices helps its real growth amid dropping nominal output. A smaller drop in prices is on the cards now: 1% y/y.
- German Retail Sales: Tuesday, 6:00. The locomotive of the euro-zone enjoyed a jump of 2.9% in sales for the month of January. A small slide of 0.9% is on the cards now in this volatile yet important figure.
- French Consumer Spending: Tuesday, 6:45. Europe’s second largest economy has seen three consecutive months of beating expectations. After a rise of 0.6% in January, a more modest rise is expected for February: 0.3%.
- German Unemployment Change: Tuesday, 7:55. The German locomotive has enjoyed 5 months of drops in unemployment. A big drop of 20K unemployed maintained the unemployment rate at a low 6.5%. Another small drop is expected for February, of 10K jobless.
- CPI Flash Estimate: Tuesday, 9:00. The euro-zone still experienced deflation in February, but less than expected at 0.3% in February. Core inflation edged up to 0.7% in the final read, providing some hope. The initial numbers for March are expected to be similar: a drop of 0.3% in headline y/y CPI and a rise of 0.6% in core CPI. Expectations may change after the German numbers are released.
- Unemployment Rate: Tuesday, 9:00. The unemployment rate in the euro-zone began dropping in recent months after being stuck for too long at 11.5%. After 11.2% reported in January, the same number is predicted for February.
- Manufacturing PMIs: Wednesday: Spain at 7:15, Italy at 7:45 and the final all euro-zone number at 8:00. Spain has seen its manufacturing PMI fall to 54.2 points, still indicating OK growth. It could tick up for March. Italy enjoyed stronger growth with 51.9 points, and another advance is likely now. According to the preliminary numbers for March, the all euro-zone figure rose to 51.9 points, mostly thanks to German strength. This will probably be confirmed now.
- ECB Meeting Minutes: Thursday, 11:30. In its March meeting, Draghi reaffirmed the commitment to QE and weighed on the euro despite raising forecasts. This complication means that the meeting minutes from the event, released for the second time, will probably be very interesting. Have the German members objected the implementation of QE?
* All times are GMT
EUR/USD Technical Analysis
Euro/dollar began the week with an advance, but the 1.10 level (mentioned last week) proved to be a tough nut to crack. While EUR/USD did hit 1.1050, it fell all the way to 1.08 before staging a bounce.
Live chart of EUR/USD: [do action=”tradingviews” pair=”EURUSD” interval=”60″/]
Technical lines from top to bottom:
The round number of 1.12 was the pivotal line in the range. It is followed by the fresh low of 1.1113 which is nearly 0.90 on USD/EUR.
1.1050 was a high point in March 2015 and is another line of resistance before the round level 1.10. This is still a battle line.
The next line was minor support back in October 1999: 1.0910. It was resistance back then and was tested once again in March 2015. This is followed by which worked in both directions.
The next line is 1.0760, which was the low point in both July and August 2003. There isn’t much support between here and 1.0615, which worked in both directions during March 2015 and is better at support.
Another minor line is 1.0550, for a role as support in the same period of time. The very round level of 1.05 served as support during 2003.
The lowest level in over 12 years is 1.0462 and this makes it critical support.
From here on, we are at levels last seen over a decade ago. We have some support at 1.0360: this was the low point in January 2003. Further down, 1.0170 worked as resistance back in November 2012. It is close to the swing high of 1.0208 seen in July of that year.
Below this point we have the very obvious level of 1 – EUR/USD parity, which is already eyed by more and more analysts
I am neutral on EUR/USD
There is probably still a significant leg down in EUR/USD, but the pair seems to have stabilized for now and could wait for after Easter for the big fall. A relieve in the ongoing Greece crisis could help in the short term. In general, ECB QE continues in full force and weighs on the common currency. In the US, it seems that the losing streak of poor data is reaching an end. We have already seen first signs of this.
In our latest podcast we interview David Stein on investment, QE and lots more
Subscribe to Market Movers on iTunes
Further reading:
- For a broad view of all the week’s major events worldwide, read the USD outlook.
- For the Japanese yen, read the USD/JPY forecast.
- For GBP/USD (cable), look into the British Pound forecast.
- For the Australian dollar (Aussie), check out the AUD to USD forecast.
- USD/CAD (loonie), check out the Canadian dollar forecast
- For the kiwi, see the NZDUSD forecast.
